

358
L. D. Negro et al.
riodic structures feature multiple length scales and produce cascade enhancement
effects similar to arrays of nano-lenses [116, 117], which significantly boost the
SERS enhancement values to almost single molecule sensitivity levels.
In our experimental analysis, Raman signal measurements were performed using
a Renishaw Raman microscope (RM2000, Renishaw, IL). A 50× (N.A. = 0.55)
objective was used to focus the laser beam on a nanostructured array and to collect
the scattering light from the sample surface using a backscattering configuration. The
SERS signal was typically acquired for 10 s using 785 nm laser wavelength at 1.7 mW
excitation power. The dimension of the laser spot is constant (2.5 μm × 25 μm)
ensuring that the SERS signal from the different arrays is comparable and unaffected
by size variation.
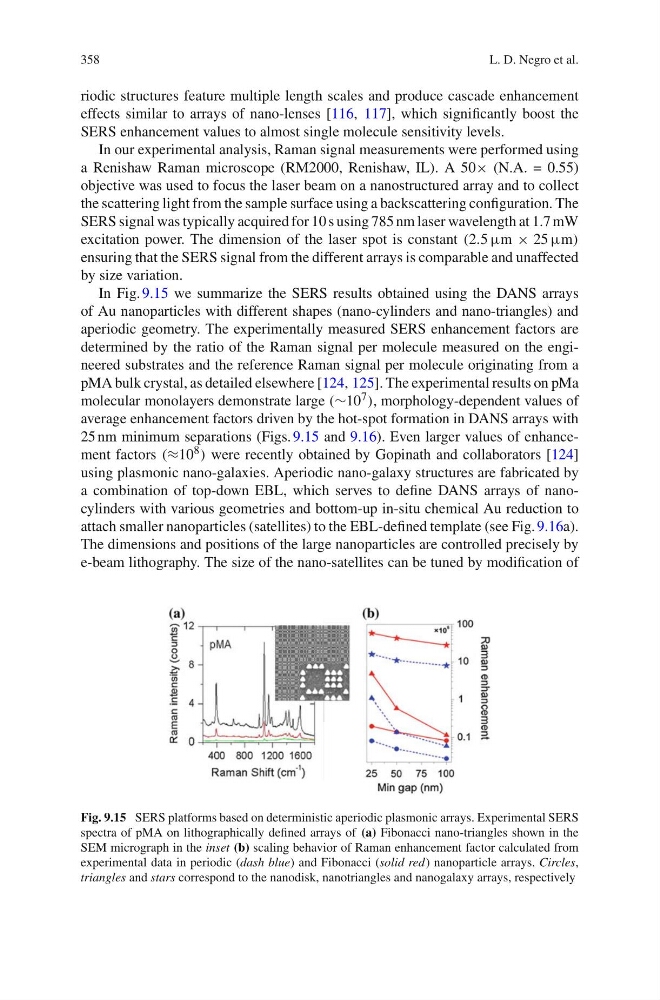
In Fig. 9.15 we summarize the SERS results obtained using the DANS arrays
of Au nanoparticles with different shapes (nano-cylinders and nano-triangles) and
aperiodic geometry. The experimentally measured SERS enhancement factors are
determined by the ratio of the Raman signal per molecule measured on the engineered substrates and the reference Raman signal per molecule originating from a
pMA bulk crystal, as detailed elsewhere [124, 125]. The experimental results on pMa
molecular monolayers demonstrate large (≥10 7 ), morphology-dependent values of
average enhancement factors driven by the hot-spot formation in DANS arrays with
25 nm minimum separations (Figs. 9.15 and 9.16). Even larger values of enhancement factors (≈10 8 ) were recently obtained by Gopinath and collaborators [124]
using plasmonic nano-galaxies. Aperiodic nano-galaxy structures are fabricated by
a combination of top-down EBL, which serves to define DANS arrays of nanocylinders with various geometries and bottom-up in-situ chemical Au reduction to
attach smaller nanoparticles (satellites) to the EBL-defined template (see Fig. 9.16a).
The dimensions and positions of the large nanoparticles are controlled precisely by
e-beam lithography. The size of the nano-satellites can be tuned by modification of
Fig. 9.15 SERS platforms based on deterministic aperiodic plasmonic arrays. Experimental SERS
spectra of pMA on lithographically defined arrays of (a) Fibonacci nano-triangles shown in the
SEM micrograph in the inset (b) scaling behavior of Raman enhancement factor calculated from
experimental data in periodic (dash blue) and Fibonacci (solid red) nanoparticle arrays. Circles,
triangles and stars correspond to the nanodisk, nanotriangles and nanogalaxy arrays, respectively
L. D. Negro et al.
riodic structures feature multiple length scales and produce cascade enhancement
effects similar to arrays of nano-lenses [116, 117], which significantly boost the
SERS enhancement values to almost single molecule sensitivity levels.
In our experimental analysis, Raman signal measurements were performed using
a Renishaw Raman microscope (RM2000, Renishaw, IL). A 50× (N.A. = 0.55)
objective was used to focus the laser beam on a nanostructured array and to collect
the scattering light from the sample surface using a backscattering configuration. The
SERS signal was typically acquired for 10 s using 785 nm laser wavelength at 1.7 mW
excitation power. The dimension of the laser spot is constant (2.5 μm × 25 μm)
ensuring that the SERS signal from the different arrays is comparable and unaffected
by size variation.
In Fig. 9.15 we summarize the SERS results obtained using the DANS arrays
of Au nanoparticles with different shapes (nano-cylinders and nano-triangles) and
aperiodic geometry. The experimentally measured SERS enhancement factors are
determined by the ratio of the Raman signal per molecule measured on the engineered substrates and the reference Raman signal per molecule originating from a
pMA bulk crystal, as detailed elsewhere [124, 125]. The experimental results on pMa
molecular monolayers demonstrate large (≥10 7 ), morphology-dependent values of
average enhancement factors driven by the hot-spot formation in DANS arrays with
25 nm minimum separations (Figs. 9.15 and 9.16). Even larger values of enhancement factors (≈10 8 ) were recently obtained by Gopinath and collaborators [124]
using plasmonic nano-galaxies. Aperiodic nano-galaxy structures are fabricated by
a combination of top-down EBL, which serves to define DANS arrays of nanocylinders with various geometries and bottom-up in-situ chemical Au reduction to
attach smaller nanoparticles (satellites) to the EBL-defined template (see Fig. 9.16a).
The dimensions and positions of the large nanoparticles are controlled precisely by
e-beam lithography. The size of the nano-satellites can be tuned by modification of
Fig. 9.15 SERS platforms based on deterministic aperiodic plasmonic arrays. Experimental SERS
spectra of pMA on lithographically defined arrays of (a) Fibonacci nano-triangles shown in the
SEM micrograph in the inset (b) scaling behavior of Raman enhancement factor calculated from
experimental data in periodic (dash blue) and Fibonacci (solid red) nanoparticle arrays. Circles,
triangles and stars correspond to the nanodisk, nanotriangles and nanogalaxy arrays, respectively