

222
M. Kauranen et al.
particles is expected to modify the tensorial properties of the SHG response, which
is obtained as the orientational average of the response of individual particles. By
this approach, one should be able to predict the SHG response of samples B and C
from that of the reference sample A.
However, the second reason proved to be even more important than the orientational distribution [92]. This arises from the fact that the efficiency of SHG depends
strongly on the existence of a resonance close to the fundamental laser wavelength.
The second-harmonic signal therefore depends both on the location of the resonance
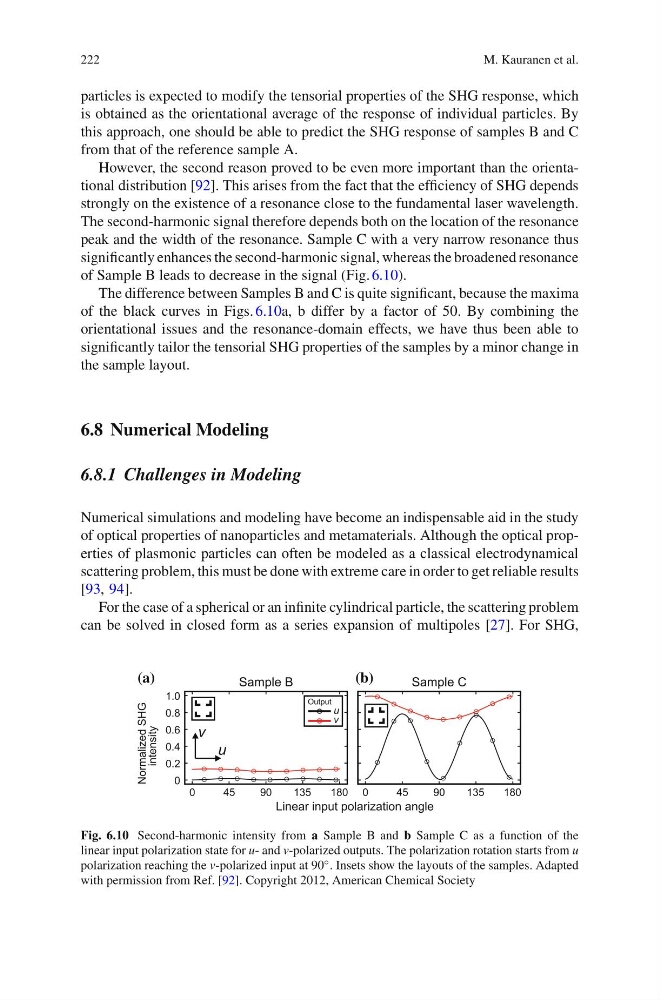
peak and the width of the resonance. Sample C with a very narrow resonance thus
significantly enhances the second-harmonic signal, whereas the broadened resonance
of Sample B leads to decrease in the signal (Fig. 6.10).
The difference between Samples B and C is quite significant, because the maxima
of the black curves in Figs. 6.10a, b differ by a factor of 50. By combining the
orientational issues and the resonance-domain effects, we have thus been able to
significantly tailor the tensorial SHG properties of the samples by a minor change in
the sample layout.
6.8 Numerical Modeling
6.8.1 Challenges in Modeling
Numerical simulations and modeling have become an indispensable aid in the study
of optical properties of nanoparticles and metamaterials. Although the optical properties of plasmonic particles can often be modeled as a classical electrodynamical
scattering problem, this must be done with extreme care in order to get reliable results
[93, 94].
For the case of a spherical or an infinite cylindrical particle, the scattering problem
can be solved in closed form as a series expansion of multipoles [27]. For SHG,
(a)
(b)
Fig. 6.10 Second-harmonic intensity from a Sample B and b Sample C as a function of the
linear input polarization state for u- and v-polarized outputs. The polarization rotation starts from u
polarization reaching the v-polarized input at 90 ◦ . Insets show the layouts of the samples. Adapted
with permission from Ref. [92]. Copyright 2012, American Chemical Society
M. Kauranen et al.
particles is expected to modify the tensorial properties of the SHG response, which
is obtained as the orientational average of the response of individual particles. By
this approach, one should be able to predict the SHG response of samples B and C
from that of the reference sample A.
However, the second reason proved to be even more important than the orientational distribution [92]. This arises from the fact that the efficiency of SHG depends
strongly on the existence of a resonance close to the fundamental laser wavelength.
The second-harmonic signal therefore depends both on the location of the resonance
peak and the width of the resonance. Sample C with a very narrow resonance thus
significantly enhances the second-harmonic signal, whereas the broadened resonance
of Sample B leads to decrease in the signal (Fig. 6.10).
The difference between Samples B and C is quite significant, because the maxima
of the black curves in Figs. 6.10a, b differ by a factor of 50. By combining the
orientational issues and the resonance-domain effects, we have thus been able to
significantly tailor the tensorial SHG properties of the samples by a minor change in
the sample layout.
6.8 Numerical Modeling
6.8.1 Challenges in Modeling
Numerical simulations and modeling have become an indispensable aid in the study
of optical properties of nanoparticles and metamaterials. Although the optical properties of plasmonic particles can often be modeled as a classical electrodynamical
scattering problem, this must be done with extreme care in order to get reliable results
[93, 94].
For the case of a spherical or an infinite cylindrical particle, the scattering problem
can be solved in closed form as a series expansion of multipoles [27]. For SHG,
(a)
(b)
Fig. 6.10 Second-harmonic intensity from a Sample B and b Sample C as a function of the
linear input polarization state for u- and v-polarized outputs. The polarization rotation starts from u
polarization reaching the v-polarized input at 90 ◦ . Insets show the layouts of the samples. Adapted
with permission from Ref. [92]. Copyright 2012, American Chemical Society