

5 Ultrafast Nonlinear Plasmonics
195
0
2
4
6
(a)
σ
x
abs (x 10
3
nm
2
)
-4
-2
0
2
(b)
a
x
2
a
x
1
a
x
1,2 (x 10
3
nm
2
)
0
2
4
6
(x10)
(d)
σ
y
abs (x 10
3
nm
2
)
0
2
4
6
(x2)
(g)
σ
abs (x 10
3
nm
2
)
-20
-10
0
10
20
(e)
a
y
2
a
y
1
a
y
1,2 (nm
2
)
-1
0
(h)
a 2
a 1
a
1,2 (x 10
3
nm
2
)
1.5
2.0
2.5
-20
-10
0
10
ω (eV)
(c)
Δσ
x
abs (nm
2
)
1.5
2.0
2.5
-20
-10
0
10
(x10)
ω (eV)
(f)
Δσ
y
abs (nm
2
)
1.5
2.0
2.5
-20
-10
0
10
(x2)
ω (eV)
(i)
Δσ
abs (nm
2
)
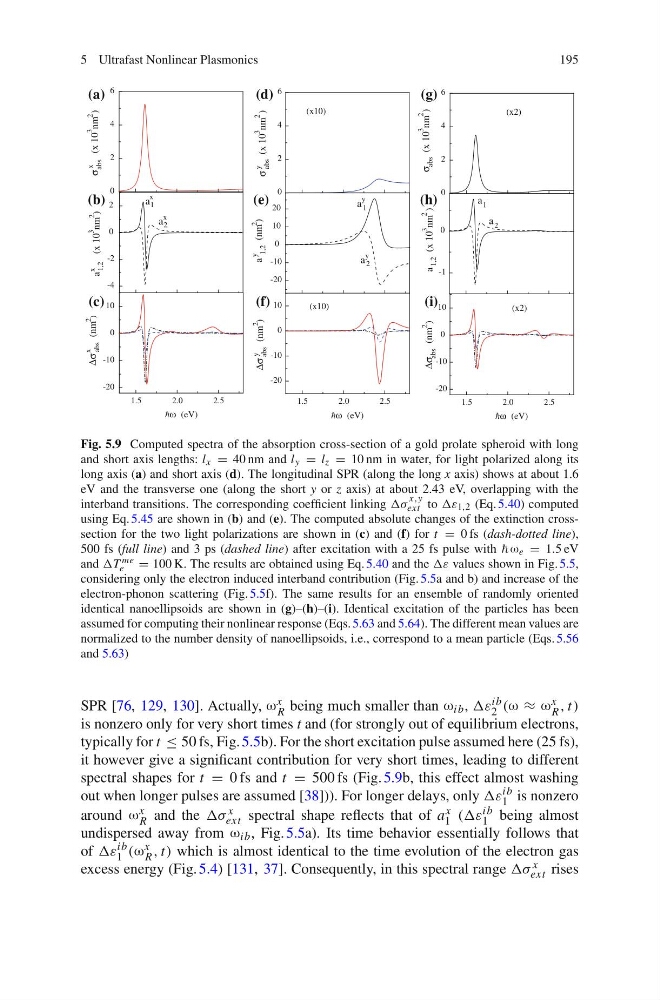
Fig. 5.9 Computed spectra of the absorption cross-section of a gold prolate spheroid with long
and short axis lengths: l x = 40 nm and l y = l z = 10 nm in water, for light polarized along its
long axis (a) and short axis (d). The longitudinal SPR (along the long x axis) shows at about 1.6
eV and the transverse one (along the short y or z axis) at about 2.43 eV, overlapping with the
interband transitions. The corresponding coefficient linking ωη
x,y
ext to ωε 1,2 (Eq. 5.40) computed
using Eq. 5.45 are shown in (b) and (e). The computed absolute changes of the extinction crosssection for the two light polarizations are shown in (c) and (f) for t = 0 fs (dash-dotted line),
500 fs (full line) and 3 ps (dashed line) after excitation with a 25 fs pulse with ω e = 1.5 eV
and ωT me
e
= 100 K. The results are obtained using Eq. 5.40 and the ωε values shown in Fig. 5.5,
considering only the electron induced interband contribution (Fig. 5.5a and b) and increase of the
electron-phonon scattering (Fig. 5.5f). The same results for an ensemble of randomly oriented
identical nanoellipsoids are shown in (g)–(h)–(i). Identical excitation of the particles has been
assumed for computing their nonlinear response (Eqs. 5.63 and 5.64). The different mean values are
normalized to the number density of nanoellipsoids, i.e., correspond to a mean particle (Eqs. 5.56
and 5.63)
SPR [76, 129, 130]. Actually, ω x
R being much smaller than ω ib , ωε ib
2 (ω ≈ ω x
R , t)
is nonzero only for very short times t and (for strongly out of equilibrium electrons,
typically for t ≤ 50 fs, Fig. 5.5b). For the short excitation pulse assumed here (25 fs),
it however give a significant contribution for very short times, leading to different
spectral shapes for t = 0 fs and t = 500 fs (Fig. 5.9b, this effect almost washing
out when longer pulses are assumed [38])). For longer delays, only ωε ib
1 is nonzero
around ω x
R and the ωη x
ext spectral shape reflects that of a x
1 (ωε ib
1 being almost
undispersed away from ω ib , Fig.5.5a). Its time behavior essentially follows that
of ωε ib
1 (ω x
R , t) which is almost identical to the time evolution of the electron gas
excess energy (Fig. 5.4) [131, 37]. Consequently, in this spectral range ωη x
ext rises
195
0
2
4
6
(a)
σ
x
abs (x 10
3
nm
2
)
-4
-2
0
2
(b)
a
x
2
a
x
1
a
x
1,2 (x 10
3
nm
2
)
0
2
4
6
(x10)
(d)
σ
y
abs (x 10
3
nm
2
)
0
2
4
6
(x2)
(g)
σ
abs (x 10
3
nm
2
)
-20
-10
0
10
20
(e)
a
y
2
a
y
1
a
y
1,2 (nm
2
)
-1
0
(h)
a 2
a 1
a
1,2 (x 10
3
nm
2
)
1.5
2.0
2.5
-20
-10
0
10
ω (eV)
(c)
Δσ
x
abs (nm
2
)
1.5
2.0
2.5
-20
-10
0
10
(x10)
ω (eV)
(f)
Δσ
y
abs (nm
2
)
1.5
2.0
2.5
-20
-10
0
10
(x2)
ω (eV)
(i)
Δσ
abs (nm
2
)
Fig. 5.9 Computed spectra of the absorption cross-section of a gold prolate spheroid with long
and short axis lengths: l x = 40 nm and l y = l z = 10 nm in water, for light polarized along its
long axis (a) and short axis (d). The longitudinal SPR (along the long x axis) shows at about 1.6
eV and the transverse one (along the short y or z axis) at about 2.43 eV, overlapping with the
interband transitions. The corresponding coefficient linking ωη
x,y
ext to ωε 1,2 (Eq. 5.40) computed
using Eq. 5.45 are shown in (b) and (e). The computed absolute changes of the extinction crosssection for the two light polarizations are shown in (c) and (f) for t = 0 fs (dash-dotted line),
500 fs (full line) and 3 ps (dashed line) after excitation with a 25 fs pulse with ω e = 1.5 eV
and ωT me
e
= 100 K. The results are obtained using Eq. 5.40 and the ωε values shown in Fig. 5.5,
considering only the electron induced interband contribution (Fig. 5.5a and b) and increase of the
electron-phonon scattering (Fig. 5.5f). The same results for an ensemble of randomly oriented
identical nanoellipsoids are shown in (g)–(h)–(i). Identical excitation of the particles has been
assumed for computing their nonlinear response (Eqs. 5.63 and 5.64). The different mean values are
normalized to the number density of nanoellipsoids, i.e., correspond to a mean particle (Eqs. 5.56
and 5.63)
SPR [76, 129, 130]. Actually, ω x
R being much smaller than ω ib , ωε ib
2 (ω ≈ ω x
R , t)
is nonzero only for very short times t and (for strongly out of equilibrium electrons,
typically for t ≤ 50 fs, Fig. 5.5b). For the short excitation pulse assumed here (25 fs),
it however give a significant contribution for very short times, leading to different
spectral shapes for t = 0 fs and t = 500 fs (Fig. 5.9b, this effect almost washing
out when longer pulses are assumed [38])). For longer delays, only ωε ib
1 is nonzero
around ω x
R and the ωη x
ext spectral shape reflects that of a x
1 (ωε ib
1 being almost
undispersed away from ω ib , Fig.5.5a). Its time behavior essentially follows that
of ωε ib
1 (ω x
R , t) which is almost identical to the time evolution of the electron gas
excess energy (Fig. 5.4) [131, 37]. Consequently, in this spectral range ωη x
ext rises