

5 Ultrafast Nonlinear Plasmonics
175
E F
d-bands
(a)
(b)
(c)
2
3
E (eV)
Δf
0.01
2
3
E (eV)
Δf
0.01
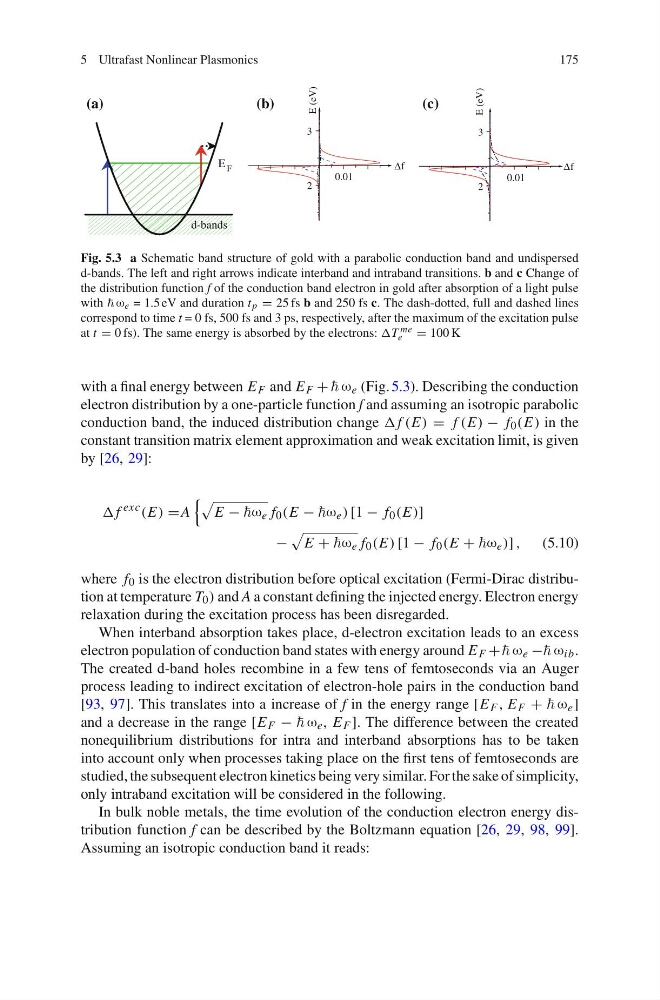
Fig. 5.3 a Schematic band structure of gold with a parabolic conduction band and undispersed
d-bands. The left and right arrows indicate interband and intraband transitions. b and c Change of
the distribution function f of the conduction band electron in gold after absorption of a light pulse
with ω e = 1.5 eV and duration t p = 25 fs b and 250 fs c. The dash-dotted, full and dashed lines
correspond to time t = 0 fs, 500 fs and 3 ps, respectively, after the maximum of the excitation pulse
at t = 0 fs). The same energy is absorbed by the electrons: ωT me
e = 100 K
with a final energy between E F and E F + ω e (Fig. 5.3). Describing the conduction
electron distribution by a one-particle function f and assuming an isotropic parabolic
conduction band, the induced distribution change ω f (E) = f (E) − f 0 (E) in the
constant transition matrix element approximation and weak excitation limit, is given
by [26, 29]:
ω f
exc
(E) =A
E − ω e f 0 (E − ω e ) [1 − f 0 (E)]
−
E + ω e f 0 (E) [1 − f 0 (E + ω e )] , (5.10)
where f 0 is the electron distribution before optical excitation (Fermi-Dirac distribution at temperature T 0 ) and A a constant defining the injected energy. Electron energy
relaxation during the excitation process has been disregarded.
When interband absorption takes place, d-electron excitation leads to an excess
electron population of conduction band states with energy around E F + ω e − ω ib .
The created d-band holes recombine in a few tens of femtoseconds via an Auger
process leading to indirect excitation of electron-hole pairs in the conduction band
[93, 97]. This translates into a increase of f in the energy range [E F , E F + ω e ]
and a decrease in the range [E F − ω e , E F ]. The difference between the created
nonequilibrium distributions for intra and interband absorptions has to be taken
into account only when processes taking place on the first tens of femtoseconds are
studied, the subsequent electron kinetics being very similar. For the sake of simplicity,
only intraband excitation will be considered in the following.
In bulk noble metals, the time evolution of the conduction electron energy distribution function f can be described by the Boltzmann equation [26, 29, 98, 99].
Assuming an isotropic conduction band it reads:
175
E F
d-bands
(a)
(b)
(c)
2
3
E (eV)
Δf
0.01
2
3
E (eV)
Δf
0.01
Fig. 5.3 a Schematic band structure of gold with a parabolic conduction band and undispersed
d-bands. The left and right arrows indicate interband and intraband transitions. b and c Change of
the distribution function f of the conduction band electron in gold after absorption of a light pulse
with ω e = 1.5 eV and duration t p = 25 fs b and 250 fs c. The dash-dotted, full and dashed lines
correspond to time t = 0 fs, 500 fs and 3 ps, respectively, after the maximum of the excitation pulse
at t = 0 fs). The same energy is absorbed by the electrons: ωT me
e = 100 K
with a final energy between E F and E F + ω e (Fig. 5.3). Describing the conduction
electron distribution by a one-particle function f and assuming an isotropic parabolic
conduction band, the induced distribution change ω f (E) = f (E) − f 0 (E) in the
constant transition matrix element approximation and weak excitation limit, is given
by [26, 29]:
ω f
exc
(E) =A
E − ω e f 0 (E − ω e ) [1 − f 0 (E)]
−
E + ω e f 0 (E) [1 − f 0 (E + ω e )] , (5.10)
where f 0 is the electron distribution before optical excitation (Fermi-Dirac distribution at temperature T 0 ) and A a constant defining the injected energy. Electron energy
relaxation during the excitation process has been disregarded.
When interband absorption takes place, d-electron excitation leads to an excess
electron population of conduction band states with energy around E F + ω e − ω ib .
The created d-band holes recombine in a few tens of femtoseconds via an Auger
process leading to indirect excitation of electron-hole pairs in the conduction band
[93, 97]. This translates into a increase of f in the energy range [E F , E F + ω e ]
and a decrease in the range [E F − ω e , E F ]. The difference between the created
nonequilibrium distributions for intra and interband absorptions has to be taken
into account only when processes taking place on the first tens of femtoseconds are
studied, the subsequent electron kinetics being very similar. For the sake of simplicity,
only intraband excitation will be considered in the following.
In bulk noble metals, the time evolution of the conduction electron energy distribution function f can be described by the Boltzmann equation [26, 29, 98, 99].
Assuming an isotropic conduction band it reads: