

3 Plasmonically Enhanced Dye-Sensitized Solar Cells
133
r Ag (nm)
10
20
30
40
50
0
10
20
t
AgO (nm)
14
2
4
6
8
10
12
0
C EF
12
10
8
6
4
t TiO2 = 2 nm
TiO 2
AgO
Ag
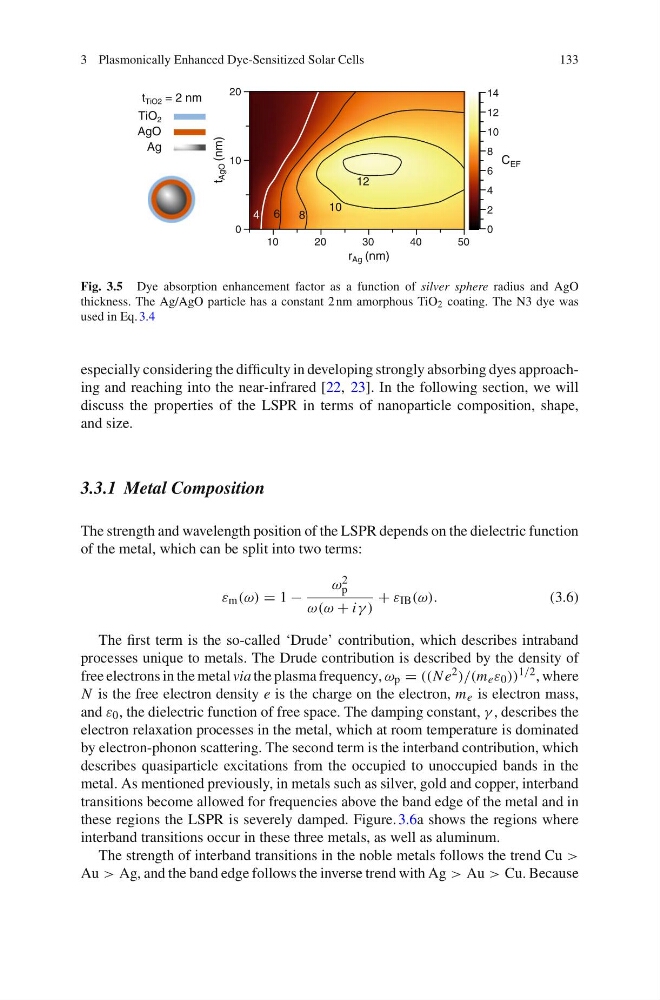
Fig. 3.5 Dye absorption enhancement factor as a function of silver sphere radius and AgO
thickness. The Ag/AgO particle has a constant 2 nm amorphous TiO 2 coating. The N3 dye was
used in Eq. 3.4
especially considering the difficulty in developing strongly absorbing dyes approaching and reaching into the near-infrared [22, 23]. In the following section, we will
discuss the properties of the LSPR in terms of nanoparticle composition, shape,
and size.
3.3.1 Metal Composition
The strength and wavelength position of the LSPR depends on the dielectric function
of the metal, which can be split into two terms:
λ m (π) = 1 −
π 2
p
π(π + iγ )
+ λ IB (π).
(3.6)
The first term is the so-called ‘Drude’ contribution, which describes intraband
processes unique to metals. The Drude contribution is described by the density of
free electrons in the metal via the plasma frequency, π p = ((N e 2 )/(m e λ 0 )) 1/2 , where
N is the free electron density e is the charge on the electron, m e is electron mass,
and λ 0 , the dielectric function of free space. The damping constant, γ , describes the
electron relaxation processes in the metal, which at room temperature is dominated
by electron-phonon scattering. The second term is the interband contribution, which
describes quasiparticle excitations from the occupied to unoccupied bands in the
metal. As mentioned previously, in metals such as silver, gold and copper, interband
transitions become allowed for frequencies above the band edge of the metal and in
these regions the LSPR is severely damped. Figure. 3.6a shows the regions where
interband transitions occur in these three metals, as well as aluminum.
The strength of interband transitions in the noble metals follows the trend Cu >
Au > Ag, and the band edge follows the inverse trend with Ag > Au > Cu. Because
133
r Ag (nm)
10
20
30
40
50
0
10
20
t
AgO (nm)
14
2
4
6
8
10
12
0
C EF
12
10
8
6
4
t TiO2 = 2 nm
TiO 2
AgO
Ag
Fig. 3.5 Dye absorption enhancement factor as a function of silver sphere radius and AgO
thickness. The Ag/AgO particle has a constant 2 nm amorphous TiO 2 coating. The N3 dye was
used in Eq. 3.4
especially considering the difficulty in developing strongly absorbing dyes approaching and reaching into the near-infrared [22, 23]. In the following section, we will
discuss the properties of the LSPR in terms of nanoparticle composition, shape,
and size.
3.3.1 Metal Composition
The strength and wavelength position of the LSPR depends on the dielectric function
of the metal, which can be split into two terms:
λ m (π) = 1 −
π 2
p
π(π + iγ )
+ λ IB (π).
(3.6)
The first term is the so-called ‘Drude’ contribution, which describes intraband
processes unique to metals. The Drude contribution is described by the density of
free electrons in the metal via the plasma frequency, π p = ((N e 2 )/(m e λ 0 )) 1/2 , where
N is the free electron density e is the charge on the electron, m e is electron mass,
and λ 0 , the dielectric function of free space. The damping constant, γ , describes the
electron relaxation processes in the metal, which at room temperature is dominated
by electron-phonon scattering. The second term is the interband contribution, which
describes quasiparticle excitations from the occupied to unoccupied bands in the
metal. As mentioned previously, in metals such as silver, gold and copper, interband
transitions become allowed for frequencies above the band edge of the metal and in
these regions the LSPR is severely damped. Figure. 3.6a shows the regions where
interband transitions occur in these three metals, as well as aluminum.
The strength of interband transitions in the noble metals follows the trend Cu >
Au > Ag, and the band edge follows the inverse trend with Ag > Au > Cu. Because