

2 Plasmonics for Enhanced Vibrational Signatures
117
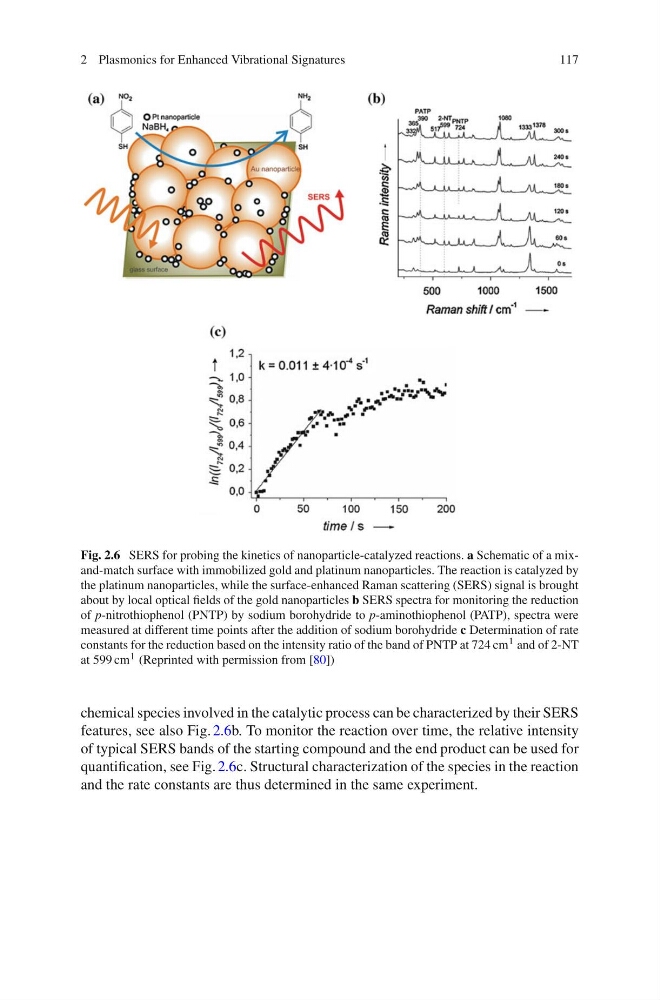
Fig. 2.6 SERS for probing the kinetics of nanoparticle-catalyzed reactions. a Schematic of a mixand-match surface with immobilized gold and platinum nanoparticles. The reaction is catalyzed by
the platinum nanoparticles, while the surface-enhanced Raman scattering (SERS) signal is brought
about by local optical fields of the gold nanoparticles b SERS spectra for monitoring the reduction
of p-nitrothiophenol (PNTP) by sodium borohydride to p-aminothiophenol (PATP), spectra were
measured at different time points after the addition of sodium borohydride c Determination of rate
constants for the reduction based on the intensity ratio of the band of PNTP at 724 cm 1 and of 2-NT
at 599 cm 1 (Reprinted with permission from [80])
chemical species involved in the catalytic process can be characterized by their SERS
features, see also Fig. 2.6b. To monitor the reaction over time, the relative intensity
of typical SERS bands of the starting compound and the end product can be used for
quantification, see Fig. 2.6c. Structural characterization of the species in the reaction
and the rate constants are thus determined in the same experiment.
117
Fig. 2.6 SERS for probing the kinetics of nanoparticle-catalyzed reactions. a Schematic of a mixand-match surface with immobilized gold and platinum nanoparticles. The reaction is catalyzed by
the platinum nanoparticles, while the surface-enhanced Raman scattering (SERS) signal is brought
about by local optical fields of the gold nanoparticles b SERS spectra for monitoring the reduction
of p-nitrothiophenol (PNTP) by sodium borohydride to p-aminothiophenol (PATP), spectra were
measured at different time points after the addition of sodium borohydride c Determination of rate
constants for the reduction based on the intensity ratio of the band of PNTP at 724 cm 1 and of 2-NT
at 599 cm 1 (Reprinted with permission from [80])
chemical species involved in the catalytic process can be characterized by their SERS
features, see also Fig. 2.6b. To monitor the reaction over time, the relative intensity
of typical SERS bands of the starting compound and the end product can be used for
quantification, see Fig. 2.6c. Structural characterization of the species in the reaction
and the rate constants are thus determined in the same experiment.