

23 Inline and Online Process Analytical Technology with an Outlook …
573
the decrease of the polarization. The polarization decreases with increasing surface
roughness and/or the number of scattering centers formed by, e.g., defect sites such
as holes or cracks in a surface layer of thin films. The proportion of depolarized light
may then be a measure of the number of defect sites within a thin film caused by
the particle density or roughness of the surface. Thus, besides the film thickness, the
defects sites within this film can be quantified simultaneously [47, 48].
23.5.2 Penetration Depth of Specular and Diffuse Reflected
Light
23.5.2.1 Photon Reflection and Photon Diffusion
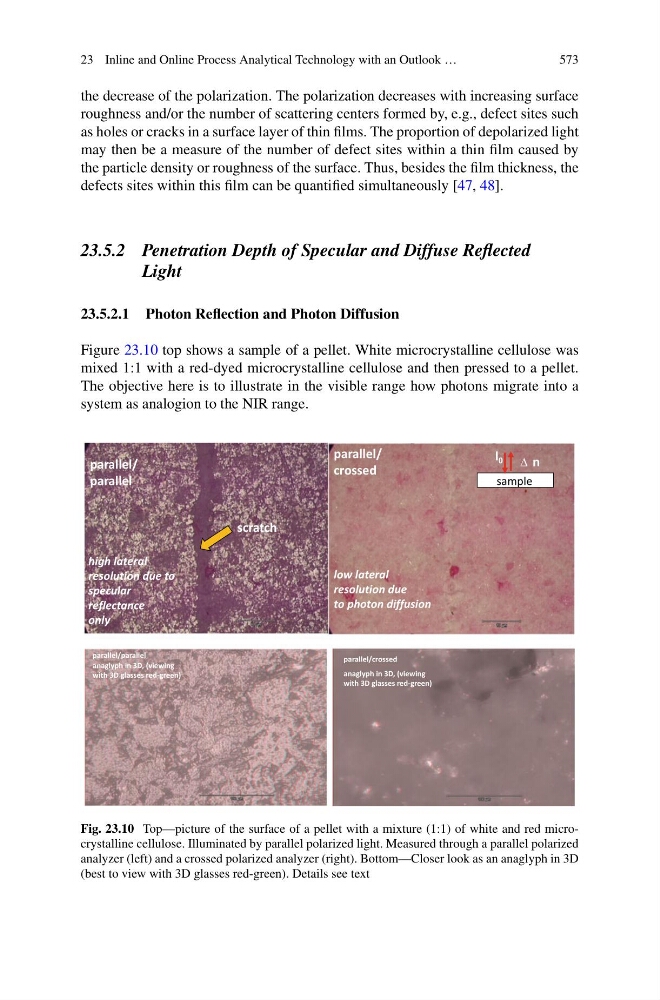
Figure 23.10 top shows a sample of a pellet. White microcrystalline cellulose was
mixed 1:1 with a red-dyed microcrystalline cellulose and then pressed to a pellet.
The objective here is to illustrate in the visible range how photons migrate into a
system as analogion to the NIR range.
parallel/parallel
anaglyph in 3D, (viewing
with 3D glasses red-green)
parallel/crossed
anaglyph in 3D, (viewing
with 3D glasses red-green)
low lateral
resolution due
to photon diffusion
parallel/
parallel
high lateral
resolution due to
specular
reflectance
only
scratch
parallel/
crossed
I 0 Δ n
sample
Fig. 23.10 Top—picture of the surface of a pellet with a mixture (1:1) of white and red microcrystalline cellulose. Illuminated by parallel polarized light. Measured through a parallel polarized
analyzer (left) and a crossed polarized analyzer (right). Bottom—Closer look as an anaglyph in 3D
(best to view with 3D glasses red-green). Details see text
573
the decrease of the polarization. The polarization decreases with increasing surface
roughness and/or the number of scattering centers formed by, e.g., defect sites such
as holes or cracks in a surface layer of thin films. The proportion of depolarized light
may then be a measure of the number of defect sites within a thin film caused by
the particle density or roughness of the surface. Thus, besides the film thickness, the
defects sites within this film can be quantified simultaneously [47, 48].
23.5.2 Penetration Depth of Specular and Diffuse Reflected
Light
23.5.2.1 Photon Reflection and Photon Diffusion
Figure 23.10 top shows a sample of a pellet. White microcrystalline cellulose was
mixed 1:1 with a red-dyed microcrystalline cellulose and then pressed to a pellet.
The objective here is to illustrate in the visible range how photons migrate into a
system as analogion to the NIR range.
parallel/parallel
anaglyph in 3D, (viewing
with 3D glasses red-green)
parallel/crossed
anaglyph in 3D, (viewing
with 3D glasses red-green)
low lateral
resolution due
to photon diffusion
parallel/
parallel
high lateral
resolution due to
specular
reflectance
only
scratch
parallel/
crossed
I 0 Δ n
sample
Fig. 23.10 Top—picture of the surface of a pellet with a mixture (1:1) of white and red microcrystalline cellulose. Illuminated by parallel polarized light. Measured through a parallel polarized
analyzer (left) and a crossed polarized analyzer (right). Bottom—Closer look as an anaglyph in 3D
(best to view with 3D glasses red-green). Details see text