

540
D. Ishikawa et al.
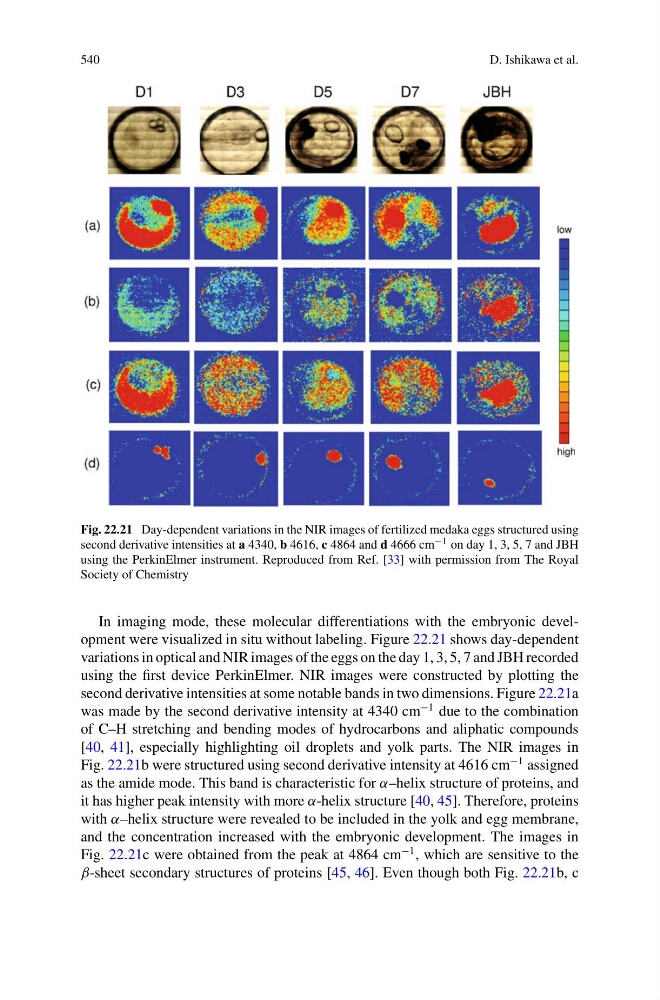
Fig. 22.21 Day-dependent variations in the NIR images of fertilized medaka eggs structured using
second derivative intensities at a 4340, b 4616, c 4864 and d 4666 cm −1 on day 1, 3, 5, 7 and JBH
using the PerkinElmer instrument. Reproduced from Ref. [33] with permission from The Royal
Society of Chemistry
In imaging mode, these molecular differentiations with the embryonic development were visualized in situ without labeling. Figure 22.21 shows day-dependent
variations in optical and NIR images of the eggs on the day 1, 3, 5, 7 and JBH recorded
using the first device PerkinElmer. NIR images were constructed by plotting the
second derivative intensities at some notable bands in two dimensions. Figure 22.21a
was made by the second derivative intensity at 4340 cm
−1 due to the combination
of C–H stretching and bending modes of hydrocarbons and aliphatic compounds
[40, 41], especially highlighting oil droplets and yolk parts. The NIR images in
Fig. 22.21b were structured using second derivative intensity at 4616 cm
−1 assigned
as the amide mode. This band is characteristic for α–helix structure of proteins, and
it has higher peak intensity with more α-helix structure [40, 45]. Therefore, proteins
with α–helix structure were revealed to be included in the yolk and egg membrane,
and the concentration increased with the embryonic development. The images in
Fig. 22.21c were obtained from the peak at 4864 cm
−1 , which are sensitive to the
β-sheet secondary structures of proteins [45, 46]. Even though both Fig. 22.21b, c
D. Ishikawa et al.
Fig. 22.21 Day-dependent variations in the NIR images of fertilized medaka eggs structured using
second derivative intensities at a 4340, b 4616, c 4864 and d 4666 cm −1 on day 1, 3, 5, 7 and JBH
using the PerkinElmer instrument. Reproduced from Ref. [33] with permission from The Royal
Society of Chemistry
In imaging mode, these molecular differentiations with the embryonic development were visualized in situ without labeling. Figure 22.21 shows day-dependent
variations in optical and NIR images of the eggs on the day 1, 3, 5, 7 and JBH recorded
using the first device PerkinElmer. NIR images were constructed by plotting the
second derivative intensities at some notable bands in two dimensions. Figure 22.21a
was made by the second derivative intensity at 4340 cm
−1 due to the combination
of C–H stretching and bending modes of hydrocarbons and aliphatic compounds
[40, 41], especially highlighting oil droplets and yolk parts. The NIR images in
Fig. 22.21b were structured using second derivative intensity at 4616 cm
−1 assigned
as the amide mode. This band is characteristic for α–helix structure of proteins, and
it has higher peak intensity with more α-helix structure [40, 45]. Therefore, proteins
with α–helix structure were revealed to be included in the yolk and egg membrane,
and the concentration increased with the embryonic development. The images in
Fig. 22.21c were obtained from the peak at 4864 cm
−1 , which are sensitive to the
β-sheet secondary structures of proteins [45, 46]. Even though both Fig. 22.21b, c