

534
D. Ishikawa et al.
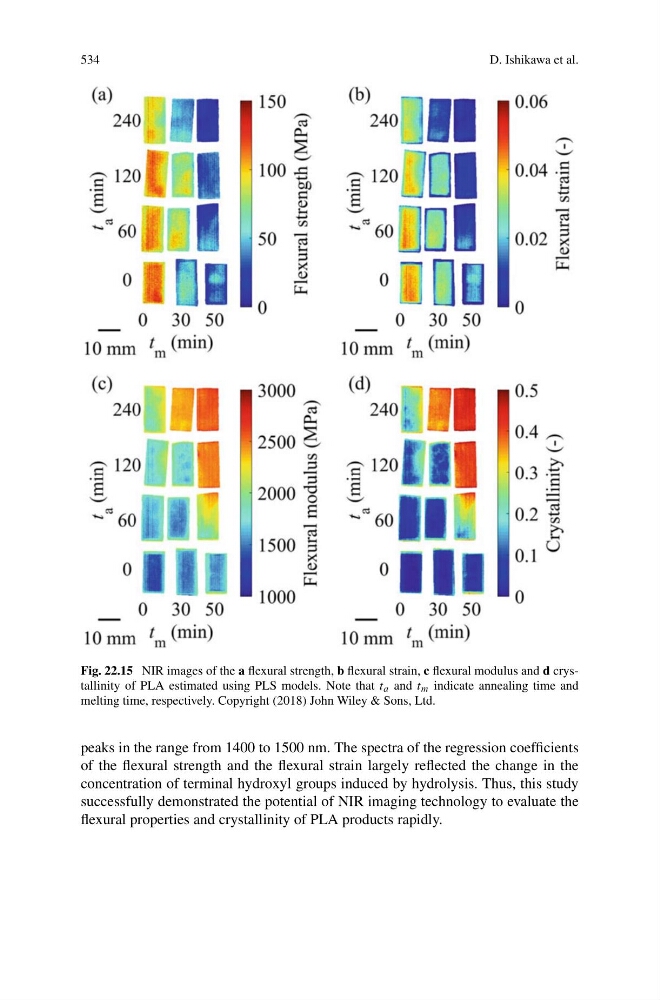
Fig. 22.15 NIR images of the a flexural strength, b flexural strain, c flexural modulus and d crystallinity of PLA estimated using PLS models. Note that t a and t m indicate annealing time and
melting time, respectively. Copyright (2018) John Wiley & Sons, Ltd.
peaks in the range from 1400 to 1500 nm. The spectra of the regression coefficients
of the flexural strength and the flexural strain largely reflected the change in the
concentration of terminal hydroxyl groups induced by hydrolysis. Thus, this study
successfully demonstrated the potential of NIR imaging technology to evaluate the
flexural properties and crystallinity of PLA products rapidly.
D. Ishikawa et al.
Fig. 22.15 NIR images of the a flexural strength, b flexural strain, c flexural modulus and d crystallinity of PLA estimated using PLS models. Note that t a and t m indicate annealing time and
melting time, respectively. Copyright (2018) John Wiley & Sons, Ltd.
peaks in the range from 1400 to 1500 nm. The spectra of the regression coefficients
of the flexural strength and the flexural strain largely reflected the change in the
concentration of terminal hydroxyl groups induced by hydrolysis. Thus, this study
successfully demonstrated the potential of NIR imaging technology to evaluate the
flexural properties and crystallinity of PLA products rapidly.