

22 NIR Imaging
533
(b)
(a)
Sample
HeaƟng
(c)
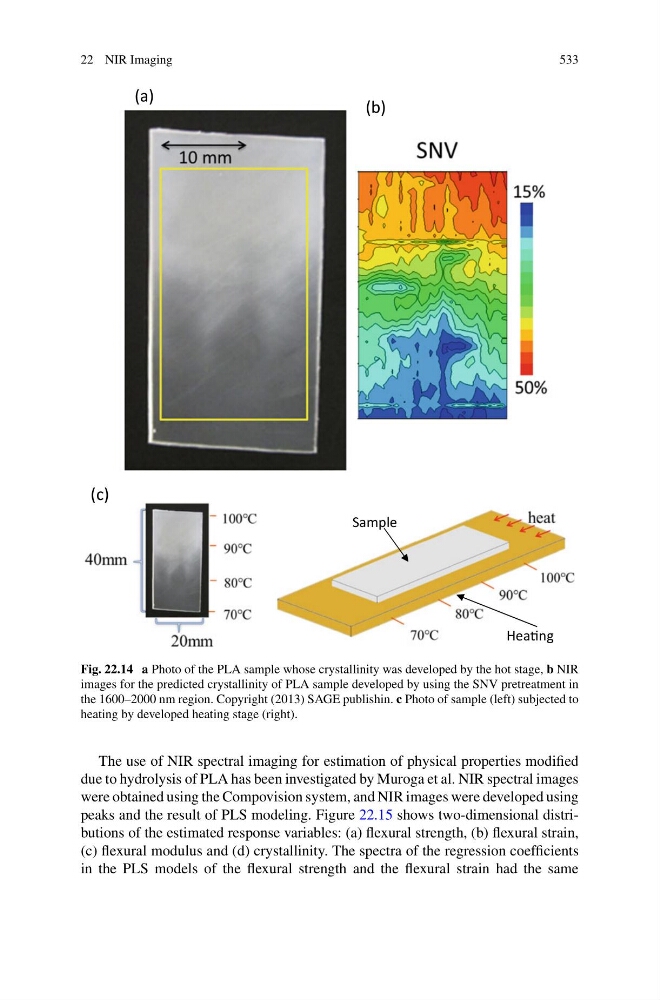
Fig. 22.14 a Photo of the PLA sample whose crystallinity was developed by the hot stage, b NIR
images for the predicted crystallinity of PLA sample developed by using the SNV pretreatment in
the 1600–2000 nm region. Copyright (2013) SAGE publishin. c Photo of sample (left) subjected to
heating by developed heating stage (right).
The use of NIR spectral imaging for estimation of physical properties modified
due to hydrolysis of PLA has been investigated by Muroga et al. NIR spectral images
were obtained using the Compovision system, and NIR images were developed using
peaks and the result of PLS modeling. Figure 22.15 shows two-dimensional distributions of the estimated response variables: (a) flexural strength, (b) flexural strain,
(c) flexural modulus and (d) crystallinity. The spectra of the regression coefficients
in the PLS models of the flexural strength and the flexural strain had the same
533
(b)
(a)
Sample
HeaƟng
(c)
Fig. 22.14 a Photo of the PLA sample whose crystallinity was developed by the hot stage, b NIR
images for the predicted crystallinity of PLA sample developed by using the SNV pretreatment in
the 1600–2000 nm region. Copyright (2013) SAGE publishin. c Photo of sample (left) subjected to
heating by developed heating stage (right).
The use of NIR spectral imaging for estimation of physical properties modified
due to hydrolysis of PLA has been investigated by Muroga et al. NIR spectral images
were obtained using the Compovision system, and NIR images were developed using
peaks and the result of PLS modeling. Figure 22.15 shows two-dimensional distributions of the estimated response variables: (a) flexural strength, (b) flexural strain,
(c) flexural modulus and (d) crystallinity. The spectra of the regression coefficients
in the PLS models of the flexural strength and the flexural strain had the same