

22 NIR Imaging
523
(a)
(b)
B
C
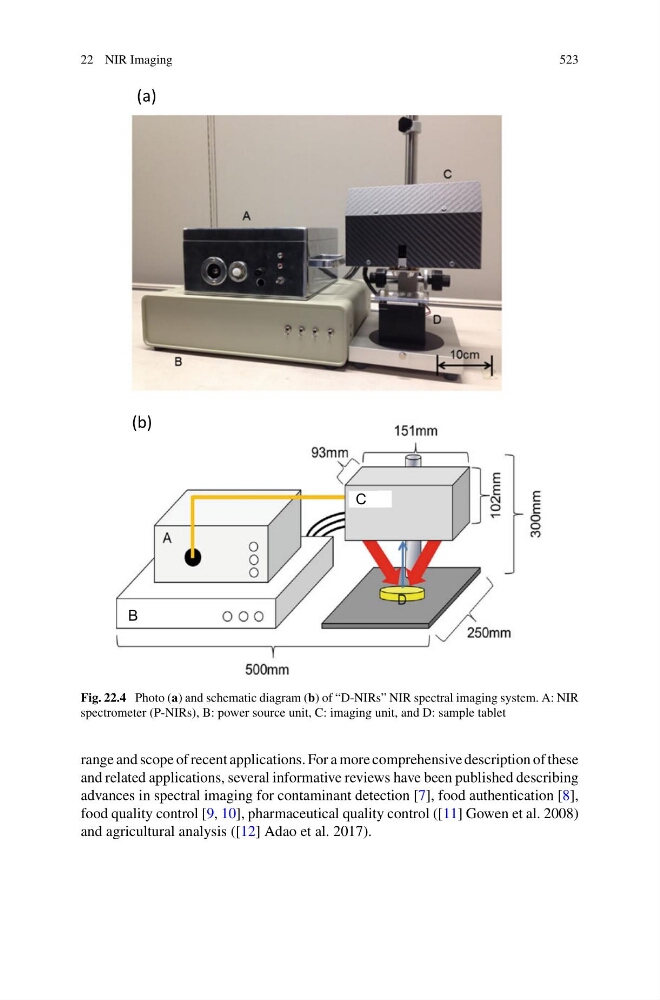
Fig. 22.4 Photo (a) and schematic diagram (b) of “D-NIRs” NIR spectral imaging system. A: NIR
spectrometer (P-NIRs), B: power source unit, C: imaging unit, and D: sample tablet
range and scope of recent applications. For a more comprehensive description of these
and related applications, several informative reviews have been published describing
advances in spectral imaging for contaminant detection [7], food authentication [8],
food quality control [9, 10], pharmaceutical quality control ([11] Gowen et al. 2008)
and agricultural analysis ([12] Adao et al. 2017).
523
(a)
(b)
B
C
Fig. 22.4 Photo (a) and schematic diagram (b) of “D-NIRs” NIR spectral imaging system. A: NIR
spectrometer (P-NIRs), B: power source unit, C: imaging unit, and D: sample tablet
range and scope of recent applications. For a more comprehensive description of these
and related applications, several informative reviews have been published describing
advances in spectral imaging for contaminant detection [7], food authentication [8],
food quality control [9, 10], pharmaceutical quality control ([11] Gowen et al. 2008)
and agricultural analysis ([12] Adao et al. 2017).