

520
D. Ishikawa et al.
22.2 Instrumentation
22.2.1 General Features of NIR Imaging Device
Different instrumental setups exist for the acquisition of NIR images. These can vary
in terms of modality (e.g., reflectance, transmission), components (e.g., light sources,
detectors) and in how the spectral image is acquired. Quartz tungsten-halogen (QTH)
light bulbs are often used as light sources in NIR imaging as they are low cost and
cover a broad wavelength range, from 400 to 2500 nm; however, they generate significant amounts of heat, and this may alter or even burn a sample. To overcome this
issue, fiber-optic lines can be used to transmit the light. The detector employed in an
NIR imaging system is typically selected based on the required wavelength range,
and various options exist. Systems operating in the 400–1000 nm wavelength range
typically use charge-coupled device (CCD) or complementary metal-oxide semiconductor (CMOS) sensors. Such detectors are suitable for imaging in the wavelength range 300–1000 nm. Indium gallium arsenide (InGaAs) or mercury cadmium
telluride (MCT) detectors are more commonly used for NIR imaging in the 1000–
2500 nm range. However, these detectors are more expensive than CCDs and require
cooling. Detectors used in NIR imaging often exhibit noise at extreme edges of the
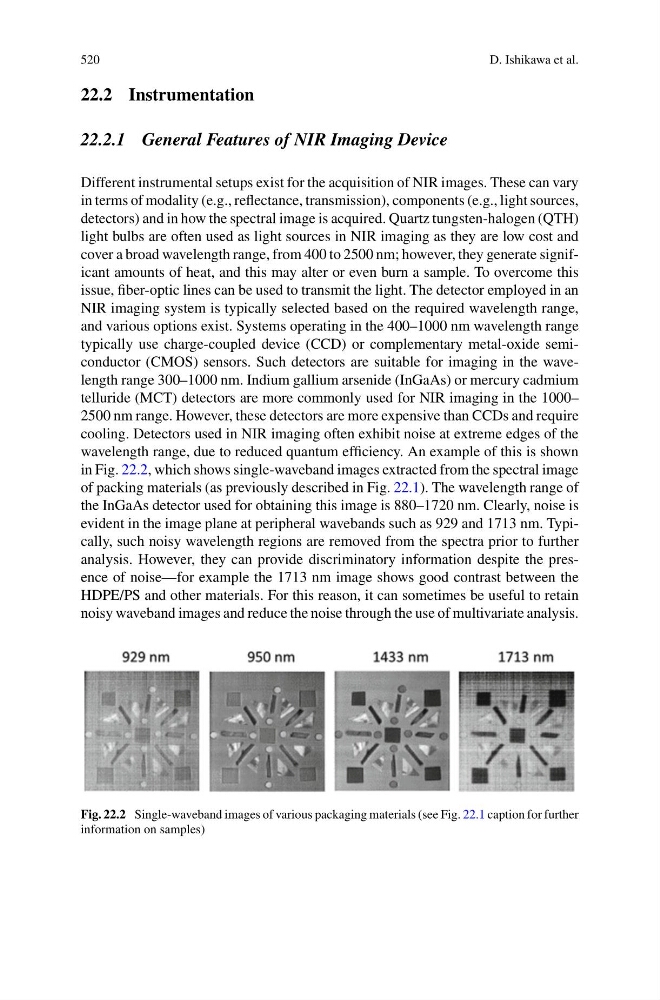
wavelength range, due to reduced quantum efficiency. An example of this is shown
in Fig. 22.2, which shows single-waveband images extracted from the spectral image
of packing materials (as previously described in Fig. 22.1). The wavelength range of
the InGaAs detector used for obtaining this image is 880–1720 nm. Clearly, noise is
evident in the image plane at peripheral wavebands such as 929 and 1713 nm. Typically, such noisy wavelength regions are removed from the spectra prior to further
analysis. However, they can provide discriminatory information despite the presence of noise—for example the 1713 nm image shows good contrast between the
HDPE/PS and other materials. For this reason, it can sometimes be useful to retain
noisy waveband images and reduce the noise through the use of multivariate analysis.
Fig. 22.2 Single-waveband images of various packaging materials (see Fig. 22.1 caption for further
information on samples)
D. Ishikawa et al.
22.2 Instrumentation
22.2.1 General Features of NIR Imaging Device
Different instrumental setups exist for the acquisition of NIR images. These can vary
in terms of modality (e.g., reflectance, transmission), components (e.g., light sources,
detectors) and in how the spectral image is acquired. Quartz tungsten-halogen (QTH)
light bulbs are often used as light sources in NIR imaging as they are low cost and
cover a broad wavelength range, from 400 to 2500 nm; however, they generate significant amounts of heat, and this may alter or even burn a sample. To overcome this
issue, fiber-optic lines can be used to transmit the light. The detector employed in an
NIR imaging system is typically selected based on the required wavelength range,
and various options exist. Systems operating in the 400–1000 nm wavelength range
typically use charge-coupled device (CCD) or complementary metal-oxide semiconductor (CMOS) sensors. Such detectors are suitable for imaging in the wavelength range 300–1000 nm. Indium gallium arsenide (InGaAs) or mercury cadmium
telluride (MCT) detectors are more commonly used for NIR imaging in the 1000–
2500 nm range. However, these detectors are more expensive than CCDs and require
cooling. Detectors used in NIR imaging often exhibit noise at extreme edges of the
wavelength range, due to reduced quantum efficiency. An example of this is shown
in Fig. 22.2, which shows single-waveband images extracted from the spectral image
of packing materials (as previously described in Fig. 22.1). The wavelength range of
the InGaAs detector used for obtaining this image is 880–1720 nm. Clearly, noise is
evident in the image plane at peripheral wavebands such as 929 and 1713 nm. Typically, such noisy wavelength regions are removed from the spectra prior to further
analysis. However, they can provide discriminatory information despite the presence of noise—for example the 1713 nm image shows good contrast between the
HDPE/PS and other materials. For this reason, it can sometimes be useful to retain
noisy waveband images and reduce the noise through the use of multivariate analysis.
Fig. 22.2 Single-waveband images of various packaging materials (see Fig. 22.1 caption for further
information on samples)