

19 Bio-applications of NIR Spectroscopy
425
constituents such as urea, glucose, lactate, phosphate and creatinine are important
for monitoring the process of detoxification, especially in ambulant dialysis treatment. Henn et al. compared these two different vibrational spectroscopic techniques
to determine the targeted molecules quantitatively in artificial dialysate solutions.
The goal of the study was to compare the definitive suitability of NIR and MIR
spectroscopy for this purpose. These methods were compared directly by means
of statistical errors determined in PLSR analysis, while using the same sample set.
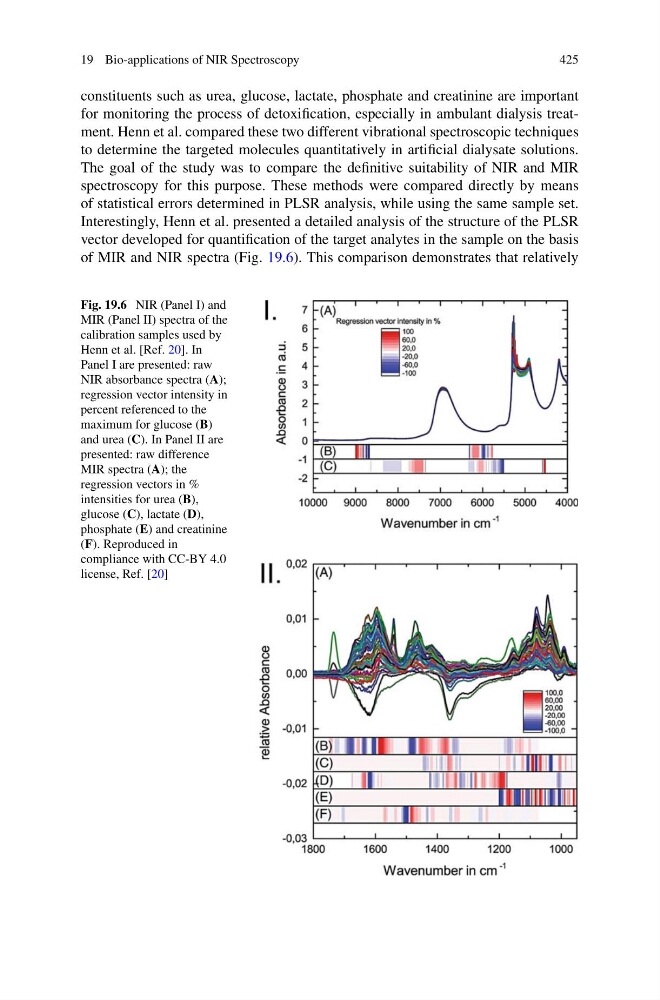
Interestingly, Henn et al. presented a detailed analysis of the structure of the PLSR
vector developed for quantification of the target analytes in the sample on the basis
of MIR and NIR spectra (Fig. 19.6). This comparison demonstrates that relatively
Fig. 19.6 NIR (Panel I) and
MIR (Panel II) spectra of the
calibration samples used by
Henn et al. [Ref. 20]. In
Panel I are presented: raw
NIR absorbance spectra (A);
regression vector intensity in
percent referenced to the
maximum for glucose (B)
and urea (C). In Panel II are
presented: raw difference
MIR spectra (A); the
regression vectors in %
intensities for urea (B),
glucose (C), lactate (D),
phosphate (E) and creatinine
(F). Reproduced in
compliance with CC-BY 4.0
license, Ref. [20]
425
constituents such as urea, glucose, lactate, phosphate and creatinine are important
for monitoring the process of detoxification, especially in ambulant dialysis treatment. Henn et al. compared these two different vibrational spectroscopic techniques
to determine the targeted molecules quantitatively in artificial dialysate solutions.
The goal of the study was to compare the definitive suitability of NIR and MIR
spectroscopy for this purpose. These methods were compared directly by means
of statistical errors determined in PLSR analysis, while using the same sample set.
Interestingly, Henn et al. presented a detailed analysis of the structure of the PLSR
vector developed for quantification of the target analytes in the sample on the basis
of MIR and NIR spectra (Fig. 19.6). This comparison demonstrates that relatively
Fig. 19.6 NIR (Panel I) and
MIR (Panel II) spectra of the
calibration samples used by
Henn et al. [Ref. 20]. In
Panel I are presented: raw
NIR absorbance spectra (A);
regression vector intensity in
percent referenced to the
maximum for glucose (B)
and urea (C). In Panel II are
presented: raw difference
MIR spectra (A); the
regression vectors in %
intensities for urea (B),
glucose (C), lactate (D),
phosphate (E) and creatinine
(F). Reproduced in
compliance with CC-BY 4.0
license, Ref. [20]