

416
C. W. Huck
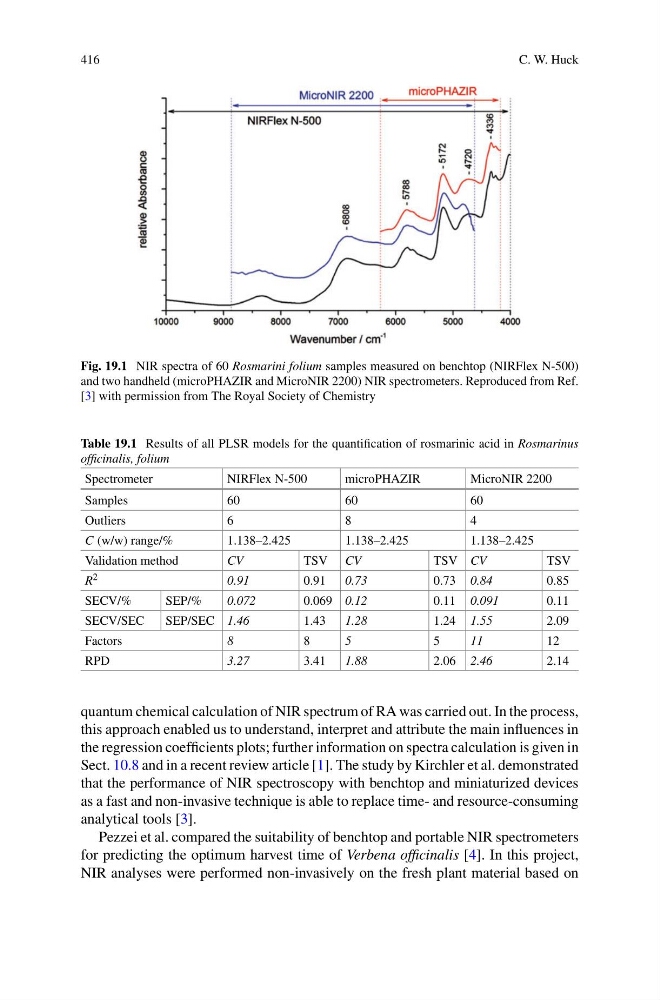
Fig. 19.1 NIR spectra of 60 Rosmarini folium samples measured on benchtop (NIRFlex N-500)
and two handheld (microPHAZIR and MicroNIR 2200) NIR spectrometers. Reproduced from Ref.
[3] with permission from The Royal Society of Chemistry
Table 19.1 Results of all PLSR models for the quantification of rosmarinic acid in Rosmarinus
officinalis, folium
Spectrometer
NIRFlex N-500
microPHAZIR
MicroNIR 2200
Samples
60
60
60
Outliers
6
8
4
C (w/w) range/%
1.138–2.425
1.138–2.425
1.138–2.425
Validation method
CV
TSV CV
TSV CV
TSV
R 2
0.91
0.91
0.73
0.73 0.84
0.85
SECV/%
SEP/%
0.072
0.069 0.12
0.11 0.091
0.11
SECV/SEC
SEP/SEC 1.46
1.43
1.28
1.24 1.55
2.09
Factors
8
8
5
5
11
12
RPD
3.27
3.41
1.88
2.06 2.46
2.14
quantum chemical calculation of NIR spectrum of RA was carried out. In the process,
this approach enabled us to understand, interpret and attribute the main influences in
the regression coefficients plots; further information on spectra calculation is given in
Sect. 10.8 and in a recent review article [1]. The study by Kirchler et al. demonstrated
that the performance of NIR spectroscopy with benchtop and miniaturized devices
as a fast and non-invasive technique is able to replace time- and resource-consuming
analytical tools [3].
Pezzei et al. compared the suitability of benchtop and portable NIR spectrometers
for predicting the optimum harvest time of Verbena officinalis [4]. In this project,
NIR analyses were performed non-invasively on the fresh plant material based on
C. W. Huck
Fig. 19.1 NIR spectra of 60 Rosmarini folium samples measured on benchtop (NIRFlex N-500)
and two handheld (microPHAZIR and MicroNIR 2200) NIR spectrometers. Reproduced from Ref.
[3] with permission from The Royal Society of Chemistry
Table 19.1 Results of all PLSR models for the quantification of rosmarinic acid in Rosmarinus
officinalis, folium
Spectrometer
NIRFlex N-500
microPHAZIR
MicroNIR 2200
Samples
60
60
60
Outliers
6
8
4
C (w/w) range/%
1.138–2.425
1.138–2.425
1.138–2.425
Validation method
CV
TSV CV
TSV CV
TSV
R 2
0.91
0.91
0.73
0.73 0.84
0.85
SECV/%
SEP/%
0.072
0.069 0.12
0.11 0.091
0.11
SECV/SEC
SEP/SEC 1.46
1.43
1.28
1.24 1.55
2.09
Factors
8
8
5
5
11
12
RPD
3.27
3.41
1.88
2.06 2.46
2.14
quantum chemical calculation of NIR spectrum of RA was carried out. In the process,
this approach enabled us to understand, interpret and attribute the main influences in
the regression coefficients plots; further information on spectra calculation is given in
Sect. 10.8 and in a recent review article [1]. The study by Kirchler et al. demonstrated
that the performance of NIR spectroscopy with benchtop and miniaturized devices
as a fast and non-invasive technique is able to replace time- and resource-consuming
analytical tools [3].
Pezzei et al. compared the suitability of benchtop and portable NIR spectrometers
for predicting the optimum harvest time of Verbena officinalis [4]. In this project,
NIR analyses were performed non-invasively on the fresh plant material based on