

18 Near-Infrared Spectroscopy in the Pharmaceutical Industry
403
0
50
100
150
200
250
300
350
400
450
Number of rotations
0
0.005
0.01
0.015
0.02
0.025
0.03
0.035
0.04
Spectral standard deviation
Moving block stand deviation (n = 25)
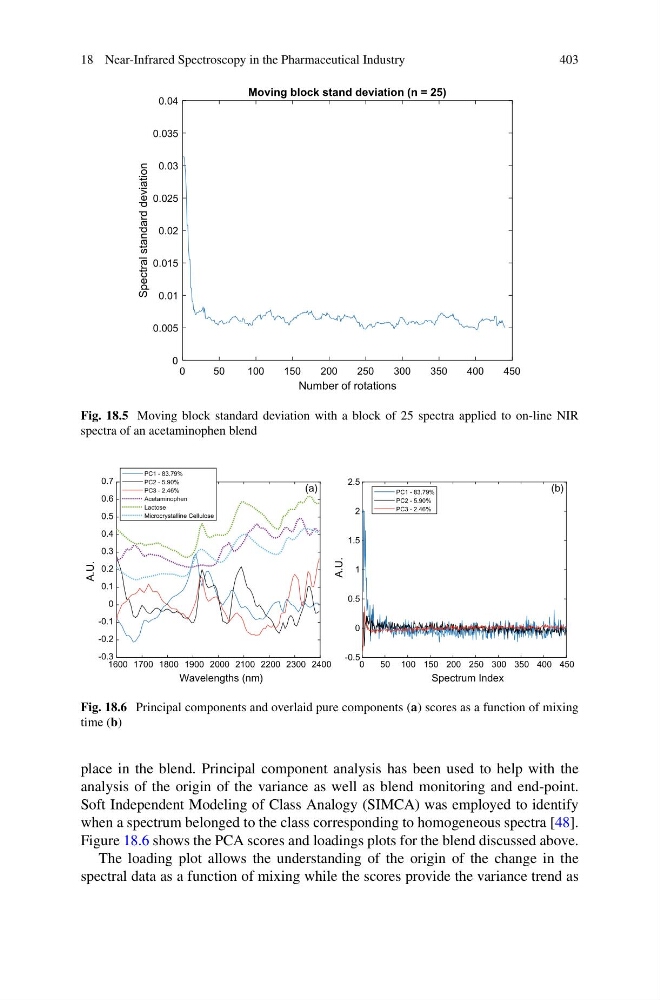
Fig. 18.5 Moving block standard deviation with a block of 25 spectra applied to on-line NIR
spectra of an acetaminophen blend
1600 1700 1800 1900 2000 2100 2200 2300 2400
Wavelengths (nm)
-0.3
-0.2
-0.1
0
0.1
0.2
0.3
0.4
0.5
0.6
0.7
A.U.
PC1 - 83.79%
PC2 - 5.90%
PC3 - 2.46%
Acetaminophen
Lactose
Microcrystalline Cellulose
0
50 100 150 200 250 300 350 400 450
Spectrum Index
-0.5
0
0.5
1
1.5
2
2.5
A.U.
PC1 - 83.79%
PC2 - 5.90%
PC3 - 2.46%
(a)
(b)
Fig. 18.6 Principal components and overlaid pure components (a) scores as a function of mixing
time (b)
place in the blend. Principal component analysis has been used to help with the
analysis of the origin of the variance as well as blend monitoring and end-point.
Soft Independent Modeling of Class Analogy (SIMCA) was employed to identify
when a spectrum belonged to the class corresponding to homogeneous spectra [48].
Figure 18.6 shows the PCA scores and loadings plots for the blend discussed above.
The loading plot allows the understanding of the origin of the change in the
spectral data as a function of mixing while the scores provide the variance trend as
403
0
50
100
150
200
250
300
350
400
450
Number of rotations
0
0.005
0.01
0.015
0.02
0.025
0.03
0.035
0.04
Spectral standard deviation
Moving block stand deviation (n = 25)
Fig. 18.5 Moving block standard deviation with a block of 25 spectra applied to on-line NIR
spectra of an acetaminophen blend
1600 1700 1800 1900 2000 2100 2200 2300 2400
Wavelengths (nm)
-0.3
-0.2
-0.1
0
0.1
0.2
0.3
0.4
0.5
0.6
0.7
A.U.
PC1 - 83.79%
PC2 - 5.90%
PC3 - 2.46%
Acetaminophen
Lactose
Microcrystalline Cellulose
0
50 100 150 200 250 300 350 400 450
Spectrum Index
-0.5
0
0.5
1
1.5
2
2.5
A.U.
PC1 - 83.79%
PC2 - 5.90%
PC3 - 2.46%
(a)
(b)
Fig. 18.6 Principal components and overlaid pure components (a) scores as a function of mixing
time (b)
place in the blend. Principal component analysis has been used to help with the
analysis of the origin of the variance as well as blend monitoring and end-point.
Soft Independent Modeling of Class Analogy (SIMCA) was employed to identify
when a spectrum belonged to the class corresponding to homogeneous spectra [48].
Figure 18.6 shows the PCA scores and loadings plots for the blend discussed above.
The loading plot allows the understanding of the origin of the change in the
spectral data as a function of mixing while the scores provide the variance trend as