

18 Near-Infrared Spectroscopy in the Pharmaceutical Industry
399
0
100
200
300
400
500
600
700
800
Time (min)
0
0.1
0.2
0.3
0.4
0.5
0.6
0.7
0.8
0.9
1
Conversion
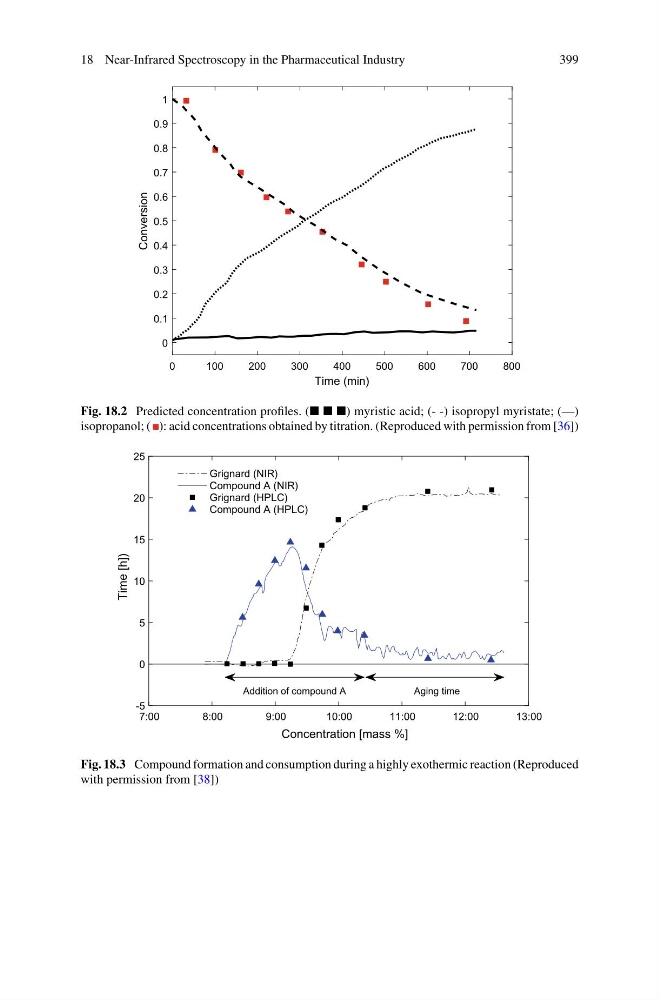
Fig. 18.2 Predicted concentration profiles. ( ) myristic acid; (- -) isopropyl myristate; (—)
isopropanol; ( ): acid concentrations obtained by titration. (Reproduced with permission from [36])
7:00
8:00
9:00
10:00
11:00
12:00
13:00
Concentration [mass %]
Time [h])
-5
0
5
10
15
20
25
Grignard (NIR)
Compound A (NIR)
Grignard (HPLC)
Compound A (HPLC)
Addition of compound A
Aging time
Fig. 18.3 Compound formation and consumption during a highly exothermic reaction (Reproduced
with permission from [38])
399
0
100
200
300
400
500
600
700
800
Time (min)
0
0.1
0.2
0.3
0.4
0.5
0.6
0.7
0.8
0.9
1
Conversion
Fig. 18.2 Predicted concentration profiles. ( ) myristic acid; (- -) isopropyl myristate; (—)
isopropanol; ( ): acid concentrations obtained by titration. (Reproduced with permission from [36])
7:00
8:00
9:00
10:00
11:00
12:00
13:00
Concentration [mass %]
Time [h])
-5
0
5
10
15
20
25
Grignard (NIR)
Compound A (NIR)
Grignard (HPLC)
Compound A (HPLC)
Addition of compound A
Aging time
Fig. 18.3 Compound formation and consumption during a highly exothermic reaction (Reproduced
with permission from [38])