

338
B. Vincent and P. Dardenne
be performed, several portions of the batch must be taken. It is advisable to collect at
least 10 sub-samples (and even better 20) of 50 g each. Then, the sub-samples, also
called primary samples, are mixed and transferred to a hermetic plastic bag, stored
and transported at low temperature to the laboratory in order to avoid deterioration.
For the farmer, knowing the composition and nutrition value of their forage
precisely and throughout the year enables feeding of the animals to be optimised
for meeting the animals’ requirements [10]. Economic losses can be avoided by
ensuring that animals receive the diet that allows them to reach optimal milk production (for instance) without a risk of underfeeding or overfeeding. On the basis of
forage quality, a farmer may either overestimate the nutritive value of feed and not
cover his animals’ needs, or underestimate it, with the risk of producing manure
that is too rich and could potentially pollute the environment (Minet et al., to be
published). Determining the chemical composition and nutritive value of feed ingredients produced at the farm is crucial. Even though several initiatives are being taken
to perform it at the farm on fresh samples, this determination is usually done on
previously dried and ground samples in an external laboratory using classical chemical methods or NIR methods. Several studies and reviews on the potential of NIR
for assessing feeding values of forages exist. Generally, the LOCAL approach gives
better results for the analysis of forages [17].
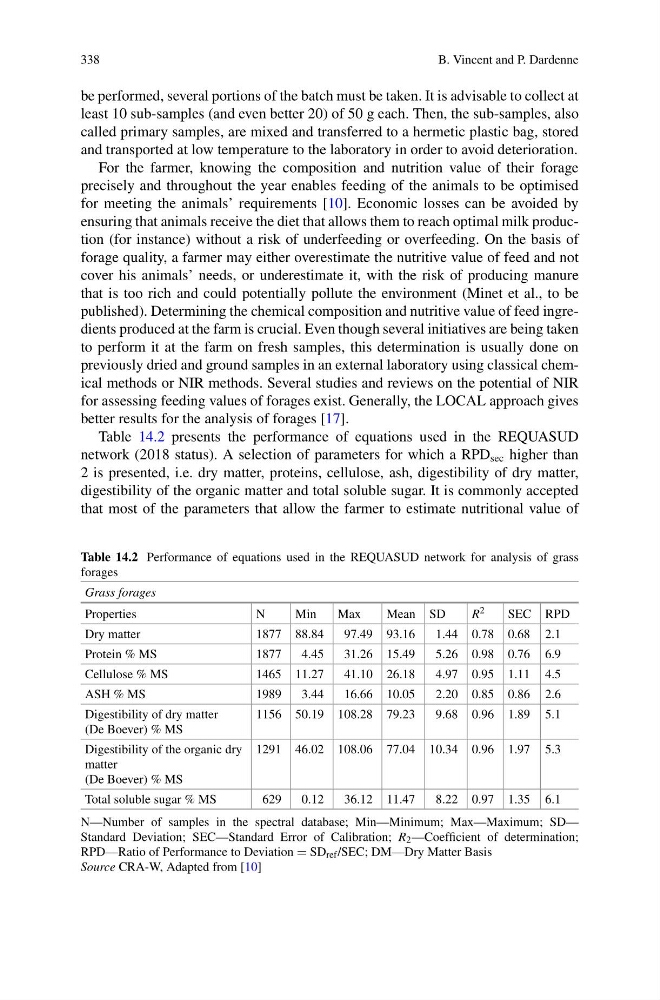
Table 14.2 presents the performance of equations used in the REQUASUD
network (2018 status). A selection of parameters for which a RPD sec higher than
2 is presented, i.e. dry matter, proteins, cellulose, ash, digestibility of dry matter,
digestibility of the organic matter and total soluble sugar. It is commonly accepted
that most of the parameters that allow the farmer to estimate nutritional value of
Table 14.2 Performance of equations used in the REQUASUD network for analysis of grass
forages
Grass forages
Properties
N
Min
Max
Mean SD
R 2
SEC RPD
Dry matter
1877 88.84
97.49 93.16
1.44 0.78 0.68 2.1
Protein % MS
1877
4.45
31.26 15.49
5.26 0.98 0.76 6.9
Cellulose % MS
1465 11.27
41.10 26.18
4.97 0.95 1.11 4.5
ASH % MS
1989
3.44
16.66 10.05
2.20 0.85 0.86 2.6
Digestibility of dry matter
(De Boever) % MS
1156 50.19 108.28 79.23
9.68 0.96 1.89 5.1
Digestibility of the organic dry
matter
(De Boever) % MS
1291 46.02 108.06 77.04 10.34 0.96 1.97 5.3
Total soluble sugar % MS
629
0.12
36.12 11.47
8.22 0.97 1.35 6.1
N—Number of samples in the spectral database; Min—Minimum; Max—Maximum; SD—
Standard Deviation; SEC—Standard Error of Calibration; R 2 —Coefficient of determination;
RPD—Ratio of Performance to Deviation = SD ref /SEC; DM—Dry Matter Basis
Source CRA-W, Adapted from [10]
B. Vincent and P. Dardenne
be performed, several portions of the batch must be taken. It is advisable to collect at
least 10 sub-samples (and even better 20) of 50 g each. Then, the sub-samples, also
called primary samples, are mixed and transferred to a hermetic plastic bag, stored
and transported at low temperature to the laboratory in order to avoid deterioration.
For the farmer, knowing the composition and nutrition value of their forage
precisely and throughout the year enables feeding of the animals to be optimised
for meeting the animals’ requirements [10]. Economic losses can be avoided by
ensuring that animals receive the diet that allows them to reach optimal milk production (for instance) without a risk of underfeeding or overfeeding. On the basis of
forage quality, a farmer may either overestimate the nutritive value of feed and not
cover his animals’ needs, or underestimate it, with the risk of producing manure
that is too rich and could potentially pollute the environment (Minet et al., to be
published). Determining the chemical composition and nutritive value of feed ingredients produced at the farm is crucial. Even though several initiatives are being taken
to perform it at the farm on fresh samples, this determination is usually done on
previously dried and ground samples in an external laboratory using classical chemical methods or NIR methods. Several studies and reviews on the potential of NIR
for assessing feeding values of forages exist. Generally, the LOCAL approach gives
better results for the analysis of forages [17].
Table 14.2 presents the performance of equations used in the REQUASUD
network (2018 status). A selection of parameters for which a RPD sec higher than
2 is presented, i.e. dry matter, proteins, cellulose, ash, digestibility of dry matter,
digestibility of the organic matter and total soluble sugar. It is commonly accepted
that most of the parameters that allow the farmer to estimate nutritional value of
Table 14.2 Performance of equations used in the REQUASUD network for analysis of grass
forages
Grass forages
Properties
N
Min
Max
Mean SD
R 2
SEC RPD
Dry matter
1877 88.84
97.49 93.16
1.44 0.78 0.68 2.1
Protein % MS
1877
4.45
31.26 15.49
5.26 0.98 0.76 6.9
Cellulose % MS
1465 11.27
41.10 26.18
4.97 0.95 1.11 4.5
ASH % MS
1989
3.44
16.66 10.05
2.20 0.85 0.86 2.6
Digestibility of dry matter
(De Boever) % MS
1156 50.19 108.28 79.23
9.68 0.96 1.89 5.1
Digestibility of the organic dry
matter
(De Boever) % MS
1291 46.02 108.06 77.04 10.34 0.96 1.97 5.3
Total soluble sugar % MS
629
0.12
36.12 11.47
8.22 0.97 1.35 6.1
N—Number of samples in the spectral database; Min—Minimum; Max—Maximum; SD—
Standard Deviation; SEC—Standard Error of Calibration; R 2 —Coefficient of determination;
RPD—Ratio of Performance to Deviation = SD ref /SEC; DM—Dry Matter Basis
Source CRA-W, Adapted from [10]