

13 Overview of Application of NIR Spectroscopy to Physical …
319
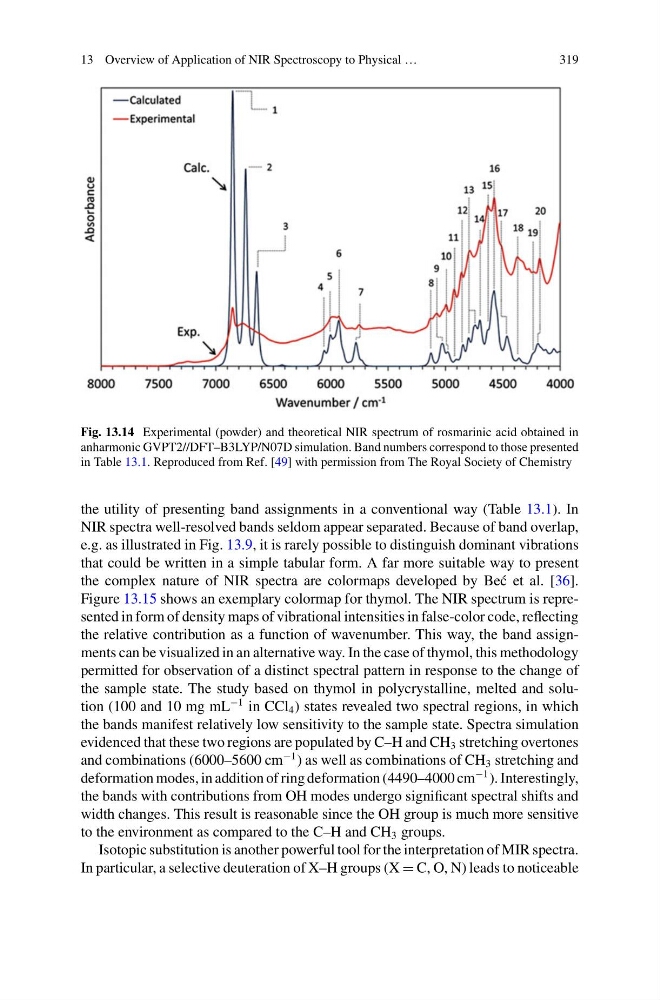
Fig. 13.14 Experimental (powder) and theoretical NIR spectrum of rosmarinic acid obtained in
anharmonic GVPT2//DFT–B3LYP/N07D simulation. Band numbers correspond to those presented
in Table 13.1. Reproduced from Ref. [49] with permission from The Royal Society of Chemistry
the utility of presenting band assignments in a conventional way (Table 13.1). In
NIR spectra well-resolved bands seldom appear separated. Because of band overlap,
e.g. as illustrated in Fig. 13.9, it is rarely possible to distinguish dominant vibrations
that could be written in a simple tabular form. A far more suitable way to present
the complex nature of NIR spectra are colormaps developed by Be´ c et al. [36].
Figure 13.15 shows an exemplary colormap for thymol. The NIR spectrum is represented in form of density maps of vibrational intensities in false-color code, reflecting
the relative contribution as a function of wavenumber. This way, the band assignments can be visualized in an alternative way. In the case of thymol, this methodology
permitted for observation of a distinct spectral pattern in response to the change of
the sample state. The study based on thymol in polycrystalline, melted and solution (100 and 10 mg mL
−1 in CCl 4 ) states revealed two spectral regions, in which
the bands manifest relatively low sensitivity to the sample state. Spectra simulation
evidenced that these two regions are populated by C–H and CH 3 stretching overtones
and combinations (6000–5600 cm
−1 ) as well as combinations of CH 3 stretching and
deformation modes, in addition of ring deformation (4490–4000 cm
−1 ). Interestingly,
the bands with contributions from OH modes undergo significant spectral shifts and
width changes. This result is reasonable since the OH group is much more sensitive
to the environment as compared to the C–H and CH 3 groups.
Isotopic substitution is another powerful tool for the interpretation of MIR spectra.
In particular, a selective deuteration of X–H groups (X = C, O, N) leads to noticeable
319
Fig. 13.14 Experimental (powder) and theoretical NIR spectrum of rosmarinic acid obtained in
anharmonic GVPT2//DFT–B3LYP/N07D simulation. Band numbers correspond to those presented
in Table 13.1. Reproduced from Ref. [49] with permission from The Royal Society of Chemistry
the utility of presenting band assignments in a conventional way (Table 13.1). In
NIR spectra well-resolved bands seldom appear separated. Because of band overlap,
e.g. as illustrated in Fig. 13.9, it is rarely possible to distinguish dominant vibrations
that could be written in a simple tabular form. A far more suitable way to present
the complex nature of NIR spectra are colormaps developed by Be´ c et al. [36].
Figure 13.15 shows an exemplary colormap for thymol. The NIR spectrum is represented in form of density maps of vibrational intensities in false-color code, reflecting
the relative contribution as a function of wavenumber. This way, the band assignments can be visualized in an alternative way. In the case of thymol, this methodology
permitted for observation of a distinct spectral pattern in response to the change of
the sample state. The study based on thymol in polycrystalline, melted and solution (100 and 10 mg mL
−1 in CCl 4 ) states revealed two spectral regions, in which
the bands manifest relatively low sensitivity to the sample state. Spectra simulation
evidenced that these two regions are populated by C–H and CH 3 stretching overtones
and combinations (6000–5600 cm
−1 ) as well as combinations of CH 3 stretching and
deformation modes, in addition of ring deformation (4490–4000 cm
−1 ). Interestingly,
the bands with contributions from OH modes undergo significant spectral shifts and
width changes. This result is reasonable since the OH group is much more sensitive
to the environment as compared to the C–H and CH 3 groups.
Isotopic substitution is another powerful tool for the interpretation of MIR spectra.
In particular, a selective deuteration of X–H groups (X = C, O, N) leads to noticeable