

302
M. A. Czarnecki et al.
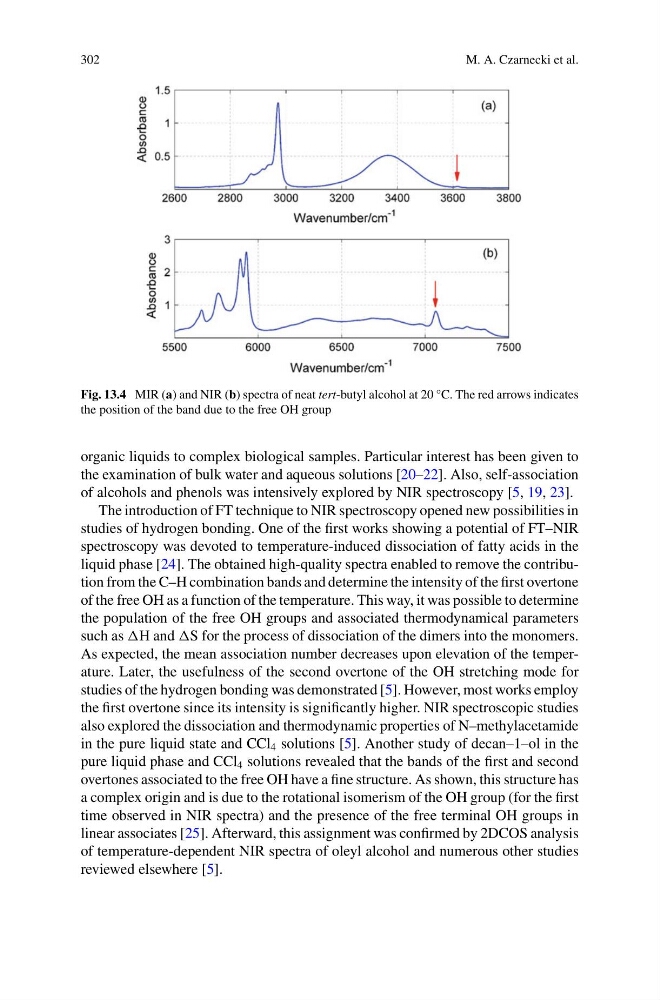
Fig. 13.4 MIR (a) and NIR (b) spectra of neat tert-butyl alcohol at 20 °C. The red arrows indicates
the position of the band due to the free OH group
organic liquids to complex biological samples. Particular interest has been given to
the examination of bulk water and aqueous solutions [20–22]. Also, self-association
of alcohols and phenols was intensively explored by NIR spectroscopy [5, 19, 23].
The introduction of FT technique to NIR spectroscopy opened new possibilities in
studies of hydrogen bonding. One of the first works showing a potential of FT–NIR
spectroscopy was devoted to temperature-induced dissociation of fatty acids in the
liquid phase [24]. The obtained high-quality spectra enabled to remove the contribution from the C–H combination bands and determine the intensity of the first overtone
of the free OH as a function of the temperature. This way, it was possible to determine
the population of the free OH groups and associated thermodynamical parameters
such as H and S for the process of dissociation of the dimers into the monomers.
As expected, the mean association number decreases upon elevation of the temperature. Later, the usefulness of the second overtone of the OH stretching mode for
studies of the hydrogen bonding was demonstrated [5]. However, most works employ
the first overtone since its intensity is significantly higher. NIR spectroscopic studies
also explored the dissociation and thermodynamic properties of N–methylacetamide
in the pure liquid state and CCl 4 solutions [5]. Another study of decan–1–ol in the
pure liquid phase and CCl 4 solutions revealed that the bands of the first and second
overtones associated to the free OH have a fine structure. As shown, this structure has
a complex origin and is due to the rotational isomerism of the OH group (for the first
time observed in NIR spectra) and the presence of the free terminal OH groups in
linear associates [25]. Afterward, this assignment was confirmed by 2DCOS analysis
of temperature-dependent NIR spectra of oleyl alcohol and numerous other studies
reviewed elsewhere [5].
M. A. Czarnecki et al.
Fig. 13.4 MIR (a) and NIR (b) spectra of neat tert-butyl alcohol at 20 °C. The red arrows indicates
the position of the band due to the free OH group
organic liquids to complex biological samples. Particular interest has been given to
the examination of bulk water and aqueous solutions [20–22]. Also, self-association
of alcohols and phenols was intensively explored by NIR spectroscopy [5, 19, 23].
The introduction of FT technique to NIR spectroscopy opened new possibilities in
studies of hydrogen bonding. One of the first works showing a potential of FT–NIR
spectroscopy was devoted to temperature-induced dissociation of fatty acids in the
liquid phase [24]. The obtained high-quality spectra enabled to remove the contribution from the C–H combination bands and determine the intensity of the first overtone
of the free OH as a function of the temperature. This way, it was possible to determine
the population of the free OH groups and associated thermodynamical parameters
such as H and S for the process of dissociation of the dimers into the monomers.
As expected, the mean association number decreases upon elevation of the temperature. Later, the usefulness of the second overtone of the OH stretching mode for
studies of the hydrogen bonding was demonstrated [5]. However, most works employ
the first overtone since its intensity is significantly higher. NIR spectroscopic studies
also explored the dissociation and thermodynamic properties of N–methylacetamide
in the pure liquid state and CCl 4 solutions [5]. Another study of decan–1–ol in the
pure liquid phase and CCl 4 solutions revealed that the bands of the first and second
overtones associated to the free OH have a fine structure. As shown, this structure has
a complex origin and is due to the rotational isomerism of the OH group (for the first
time observed in NIR spectra) and the presence of the free terminal OH groups in
linear associates [25]. Afterward, this assignment was confirmed by 2DCOS analysis
of temperature-dependent NIR spectra of oleyl alcohol and numerous other studies
reviewed elsewhere [5].