

2 Principles and Characteristics of NIR Spectroscopy
19
respectively [11]. In Fig. 2.4b the second derivative spectra for 0 and 180 min are
shown. PHB is a well-known biodegradable polymer. Sato et al. [12, 13] investigated
IR spectra of PHB and found that a crystalline C = O stretching band at 1723 cm
−1
shows a large downward shift by about 20 cm
−1 compared with an amorphous C =
O stretching band at 〜1740 cm
−1 and that a crystalline CH 3 asymmetric stretching
band appears at an anomalously high frequency (3009 cm
−1 ) [12, 13]. On the basis
of the IR and x-ray crystallography studies, they concluded that the CH 3 and C = O
groups of PHB form a peculiar C–H…O = C hydrogen bonding.
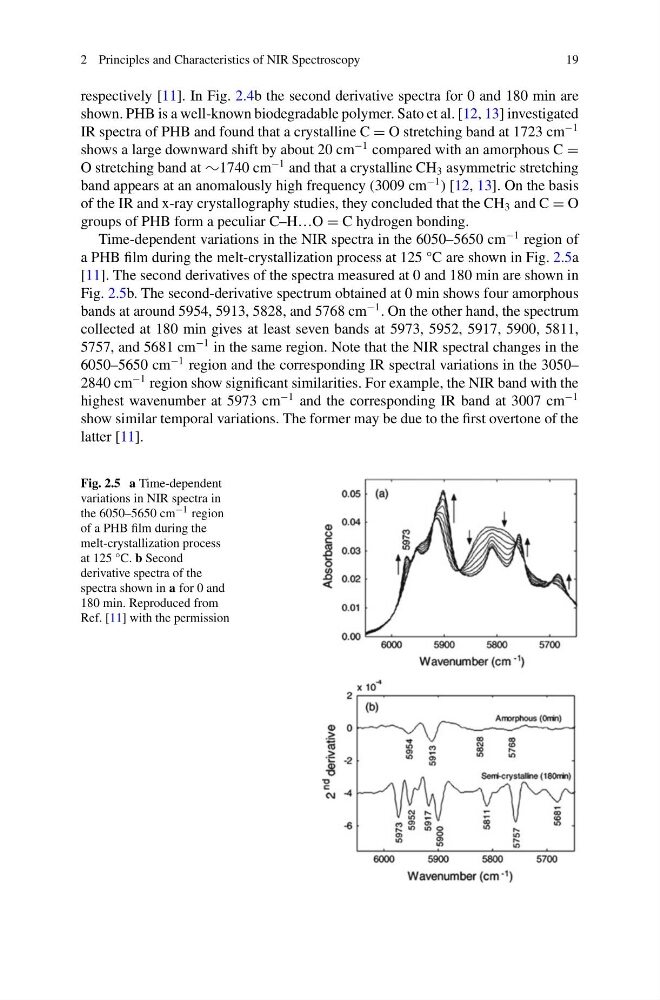
Time-dependent variations in the NIR spectra in the 6050–5650 cm
−1 region of
a PHB film during the melt-crystallization process at 125 °C are shown in Fig. 2.5a
[11]. The second derivatives of the spectra measured at 0 and 180 min are shown in
Fig. 2.5b. The second-derivative spectrum obtained at 0 min shows four amorphous
bands at around 5954, 5913, 5828, and 5768 cm
−1 . On the other hand, the spectrum
collected at 180 min gives at least seven bands at 5973, 5952, 5917, 5900, 5811,
5757, and 5681 cm
−1 in the same region. Note that the NIR spectral changes in the
6050–5650 cm
−1 region and the corresponding IR spectral variations in the 3050–
2840 cm
−1 region show significant similarities. For example, the NIR band with the
highest wavenumber at 5973 cm
−1 and the corresponding IR band at 3007 cm
−1
show similar temporal variations. The former may be due to the first overtone of the
latter [11].
Fig. 2.5 a Time-dependent
variations in NIR spectra in
the 6050–5650 cm −1 region
of a PHB film during the
melt-crystallization process
at 125 °C. b Second
derivative spectra of the
spectra shown in a for 0 and
180 min. Reproduced from
Ref. [11] with the permission
19
respectively [11]. In Fig. 2.4b the second derivative spectra for 0 and 180 min are
shown. PHB is a well-known biodegradable polymer. Sato et al. [12, 13] investigated
IR spectra of PHB and found that a crystalline C = O stretching band at 1723 cm
−1
shows a large downward shift by about 20 cm
−1 compared with an amorphous C =
O stretching band at 〜1740 cm
−1 and that a crystalline CH 3 asymmetric stretching
band appears at an anomalously high frequency (3009 cm
−1 ) [12, 13]. On the basis
of the IR and x-ray crystallography studies, they concluded that the CH 3 and C = O
groups of PHB form a peculiar C–H…O = C hydrogen bonding.
Time-dependent variations in the NIR spectra in the 6050–5650 cm
−1 region of
a PHB film during the melt-crystallization process at 125 °C are shown in Fig. 2.5a
[11]. The second derivatives of the spectra measured at 0 and 180 min are shown in
Fig. 2.5b. The second-derivative spectrum obtained at 0 min shows four amorphous
bands at around 5954, 5913, 5828, and 5768 cm
−1 . On the other hand, the spectrum
collected at 180 min gives at least seven bands at 5973, 5952, 5917, 5900, 5811,
5757, and 5681 cm
−1 in the same region. Note that the NIR spectral changes in the
6050–5650 cm
−1 region and the corresponding IR spectral variations in the 3050–
2840 cm
−1 region show significant similarities. For example, the NIR band with the
highest wavenumber at 5973 cm
−1 and the corresponding IR band at 3007 cm
−1
show similar temporal variations. The former may be due to the first overtone of the
latter [11].
Fig. 2.5 a Time-dependent
variations in NIR spectra in
the 6050–5650 cm −1 region
of a PHB film during the
melt-crystallization process
at 125 °C. b Second
derivative spectra of the
spectra shown in a for 0 and
180 min. Reproduced from
Ref. [11] with the permission