

236
T. Okura
Karl Norris specialized in the field of electronics and was unfamiliar with spectroscopy, which is based on the wavelength and height of the absorption peak. His
background enabled him to easily adopt a new scanning method and statistics to
eliminate the noise from the spectra, thus enabling the detection of subtle spectral
changes. This would have been difficult to achieve using an infrared spectrometer,
which generated the spectra on a chart paper recorder using a pen. The experiments
performed to eliminate noise were successful, and using statistics, information on
the ingredients could be retrieved from the NIR spectra [2].
10.1.1 Noise and NIR Spectroscopy
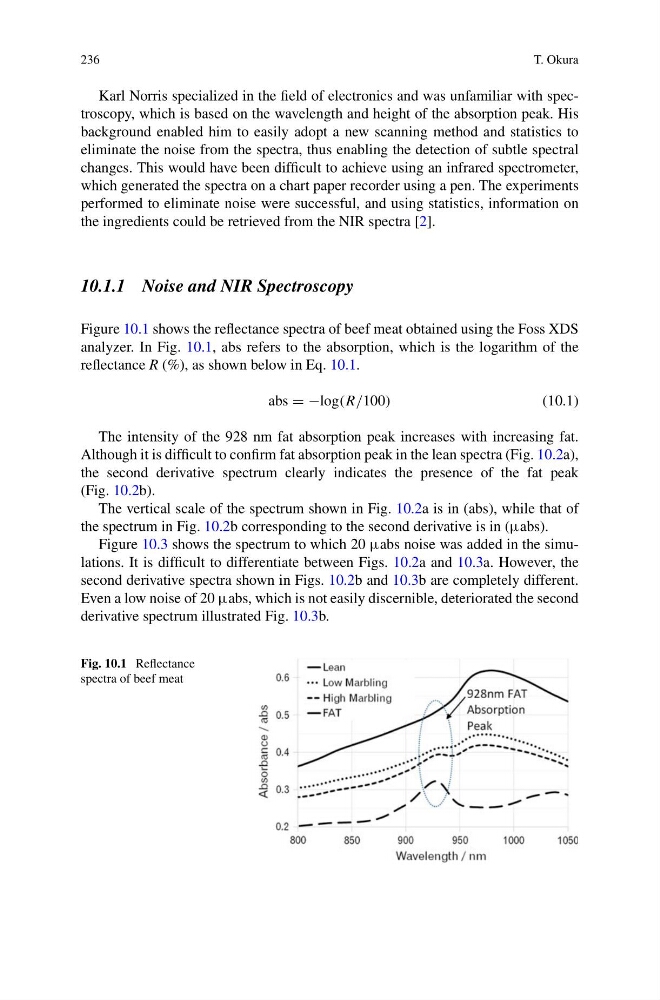
Figure 10.1 shows the reflectance spectra of beef meat obtained using the Foss XDS
analyzer. In Fig. 10.1, abs refers to the absorption, which is the logarithm of the
reflectance R (%), as shown below in Eq. 10.1.
abs = −log(R/100)
(10.1)
The intensity of the 928 nm fat absorption peak increases with increasing fat.
Although it is difficult to confirm fat absorption peak in the lean spectra (Fig. 10.2a),
the second derivative spectrum clearly indicates the presence of the fat peak
(Fig. 10.2b).
The vertical scale of the spectrum shown in Fig. 10.2a is in (abs), while that of
the spectrum in Fig. 10.2b corresponding to the second derivative is in (µabs).
Figure 10.3 shows the spectrum to which 20 µabs noise was added in the simulations. It is difficult to differentiate between Figs. 10.2a and 10.3a. However, the
second derivative spectra shown in Figs. 10.2b and 10.3b are completely different.
Even a low noise of 20 µabs, which is not easily discernible, deteriorated the second
derivative spectrum illustrated Fig. 10.3b.
Fig. 10.1 Reflectance
spectra of beef meat
T. Okura
Karl Norris specialized in the field of electronics and was unfamiliar with spectroscopy, which is based on the wavelength and height of the absorption peak. His
background enabled him to easily adopt a new scanning method and statistics to
eliminate the noise from the spectra, thus enabling the detection of subtle spectral
changes. This would have been difficult to achieve using an infrared spectrometer,
which generated the spectra on a chart paper recorder using a pen. The experiments
performed to eliminate noise were successful, and using statistics, information on
the ingredients could be retrieved from the NIR spectra [2].
10.1.1 Noise and NIR Spectroscopy
Figure 10.1 shows the reflectance spectra of beef meat obtained using the Foss XDS
analyzer. In Fig. 10.1, abs refers to the absorption, which is the logarithm of the
reflectance R (%), as shown below in Eq. 10.1.
abs = −log(R/100)
(10.1)
The intensity of the 928 nm fat absorption peak increases with increasing fat.
Although it is difficult to confirm fat absorption peak in the lean spectra (Fig. 10.2a),
the second derivative spectrum clearly indicates the presence of the fat peak
(Fig. 10.2b).
The vertical scale of the spectrum shown in Fig. 10.2a is in (abs), while that of
the spectrum in Fig. 10.2b corresponding to the second derivative is in (µabs).
Figure 10.3 shows the spectrum to which 20 µabs noise was added in the simulations. It is difficult to differentiate between Figs. 10.2a and 10.3a. However, the
second derivative spectra shown in Figs. 10.2b and 10.3b are completely different.
Even a low noise of 20 µabs, which is not easily discernible, deteriorated the second
derivative spectrum illustrated Fig. 10.3b.
Fig. 10.1 Reflectance
spectra of beef meat