

7 NIR Data Exploration and Regression by Chemometrics—A Primer
183
n
m
X =
1
2
3
4
5
1
2
3
4
1
2
3
4
1
2
3
4
1
2
3
4
1
2
3
4
+
+
n
m
E
+
n
m
n
m
n
m
X variety
5 levels
p < 0.001
13.5% effect
X position
4 levels
p < 0.001
5.0% effect
X orientation
2 levels
p < 0.245
0.4% effect
X individual
81.1% effect
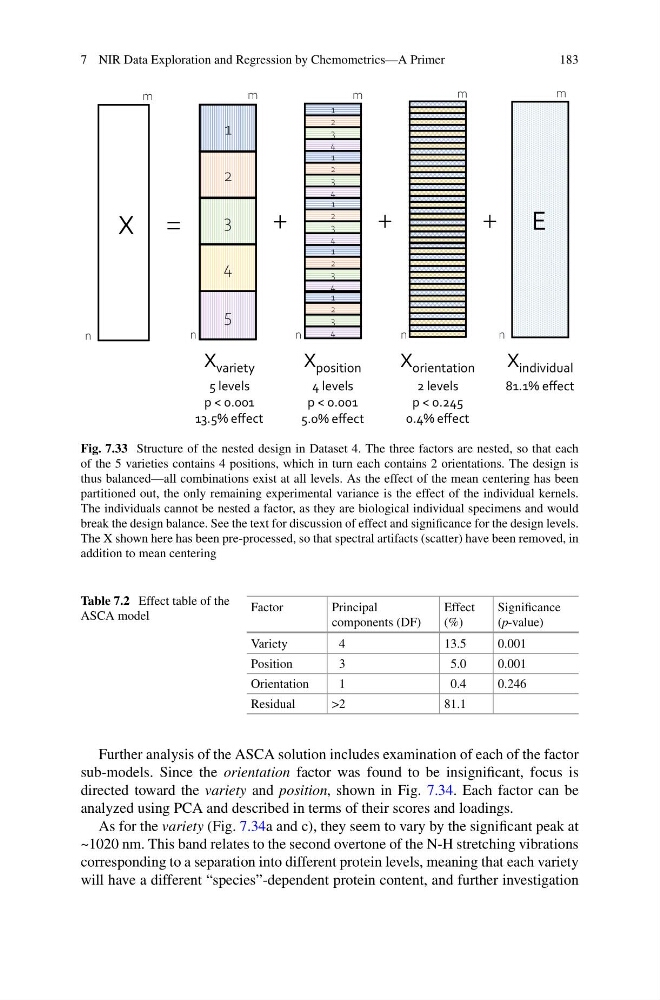
Fig. 7.33 Structure of the nested design in Dataset 4. The three factors are nested, so that each
of the 5 varieties contains 4 positions, which in turn each contains 2 orientations. The design is
thus balanced—all combinations exist at all levels. As the effect of the mean centering has been
partitioned out, the only remaining experimental variance is the effect of the individual kernels.
The individuals cannot be nested a factor, as they are biological individual specimens and would
break the design balance. See the text for discussion of effect and significance for the design levels.
The X shown here has been pre-processed, so that spectral artifacts (scatter) have been removed, in
addition to mean centering
Table 7.2 Effect table of the
ASCA model
Factor
Principal
components (DF)
Effect
(%)
Significance
(p-value)
Variety
4
13.5
0.001
Position
3
5.0
0.001
Orientation
1
0.4
0.246
Residual
>2
81.1
Further analysis of the ASCA solution includes examination of each of the factor
sub-models. Since the orientation factor was found to be insignificant, focus is
directed toward the variety and position, shown in Fig. 7.34. Each factor can be
analyzed using PCA and described in terms of their scores and loadings.
As for the variety (Fig. 7.34a and c), they seem to vary by the significant peak at
~1020 nm. This band relates to the second overtone of the N-H stretching vibrations
corresponding to a separation into different protein levels, meaning that each variety
will have a different “species”-dependent protein content, and further investigation
183
n
m
X =
1
2
3
4
5
1
2
3
4
1
2
3
4
1
2
3
4
1
2
3
4
1
2
3
4
+
+
n
m
E
+
n
m
n
m
n
m
X variety
5 levels
p < 0.001
13.5% effect
X position
4 levels
p < 0.001
5.0% effect
X orientation
2 levels
p < 0.245
0.4% effect
X individual
81.1% effect
Fig. 7.33 Structure of the nested design in Dataset 4. The three factors are nested, so that each
of the 5 varieties contains 4 positions, which in turn each contains 2 orientations. The design is
thus balanced—all combinations exist at all levels. As the effect of the mean centering has been
partitioned out, the only remaining experimental variance is the effect of the individual kernels.
The individuals cannot be nested a factor, as they are biological individual specimens and would
break the design balance. See the text for discussion of effect and significance for the design levels.
The X shown here has been pre-processed, so that spectral artifacts (scatter) have been removed, in
addition to mean centering
Table 7.2 Effect table of the
ASCA model
Factor
Principal
components (DF)
Effect
(%)
Significance
(p-value)
Variety
4
13.5
0.001
Position
3
5.0
0.001
Orientation
1
0.4
0.246
Residual
>2
81.1
Further analysis of the ASCA solution includes examination of each of the factor
sub-models. Since the orientation factor was found to be insignificant, focus is
directed toward the variety and position, shown in Fig. 7.34. Each factor can be
analyzed using PCA and described in terms of their scores and loadings.
As for the variety (Fig. 7.34a and c), they seem to vary by the significant peak at
~1020 nm. This band relates to the second overtone of the N-H stretching vibrations
corresponding to a separation into different protein levels, meaning that each variety
will have a different “species”-dependent protein content, and further investigation