

7 NIR Data Exploration and Regression by Chemometrics—A Primer
171
ACCURACY =
TP + TN
N T + N F
(7.28)
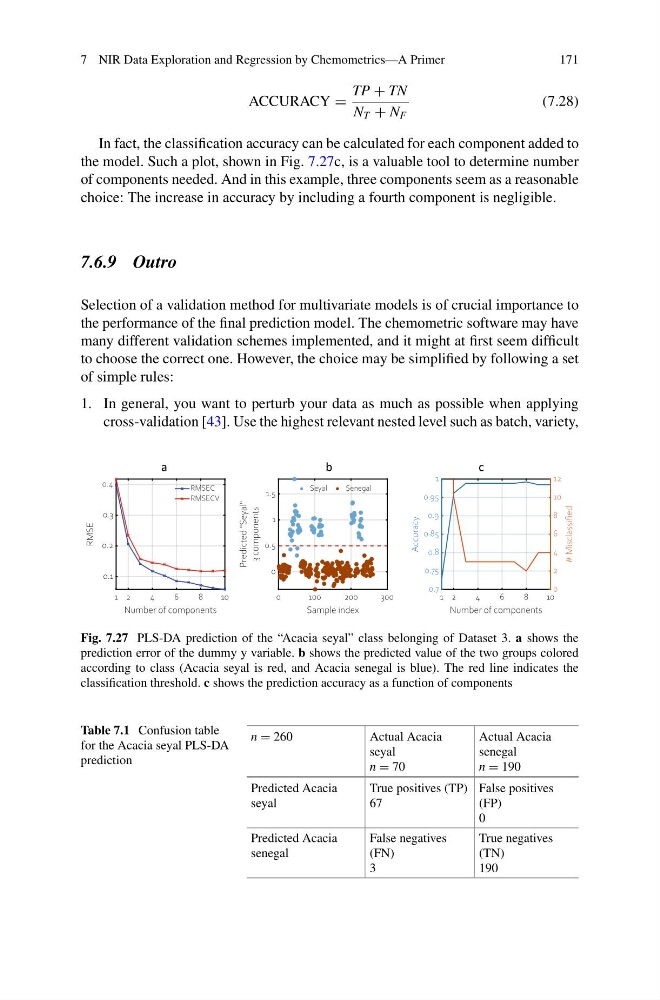
In fact, the classification accuracy can be calculated for each component added to
the model. Such a plot, shown in Fig. 7.27c, is a valuable tool to determine number
of components needed. And in this example, three components seem as a reasonable
choice: The increase in accuracy by including a fourth component is negligible.
7.6.9 Outro
Selection of a validation method for multivariate models is of crucial importance to
the performance of the final prediction model. The chemometric software may have
many different validation schemes implemented, and it might at first seem difficult
to choose the correct one. However, the choice may be simplified by following a set
of simple rules:
1. In general, you want to perturb your data as much as possible when applying
cross-validation [43]. Use the highest relevant nested level such as batch, variety,
1 2
4
6
8
10
Number of components
0.1
0.2
0.3
0.4
RMSE
RMSEC
RMSECV
0
100
200
300
Sample index
0
0.5
1
1.5
Predicted "Seyal"
3 components
Seyal
Senegal
1 2
4
6
8
10
Number of components
0.7
0.75
0.8
0.85
0.9
0.95
1
Accuracy
0
2
4
6
8
10
12
# Misclassified
a
b
c
Fig. 7.27 PLS-DA prediction of the “Acacia seyal” class belonging of Dataset 3. a shows the
prediction error of the dummy y variable. b shows the predicted value of the two groups colored
according to class (Acacia seyal is red, and Acacia senegal is blue). The red line indicates the
classification threshold. c shows the prediction accuracy as a function of components
Table 7.1 Confusion table
for the Acacia seyal PLS-DA
prediction
n = 260
Actual Acacia
seyal
n = 70
Actual Acacia
senegal
n = 190
Predicted Acacia
seyal
True positives (TP)
67
False positives
(FP)
0
Predicted Acacia
senegal
False negatives
(FN)
3
True negatives
(TN)
190
171
ACCURACY =
TP + TN
N T + N F
(7.28)
In fact, the classification accuracy can be calculated for each component added to
the model. Such a plot, shown in Fig. 7.27c, is a valuable tool to determine number
of components needed. And in this example, three components seem as a reasonable
choice: The increase in accuracy by including a fourth component is negligible.
7.6.9 Outro
Selection of a validation method for multivariate models is of crucial importance to
the performance of the final prediction model. The chemometric software may have
many different validation schemes implemented, and it might at first seem difficult
to choose the correct one. However, the choice may be simplified by following a set
of simple rules:
1. In general, you want to perturb your data as much as possible when applying
cross-validation [43]. Use the highest relevant nested level such as batch, variety,
1 2
4
6
8
10
Number of components
0.1
0.2
0.3
0.4
RMSE
RMSEC
RMSECV
0
100
200
300
Sample index
0
0.5
1
1.5
Predicted "Seyal"
3 components
Seyal
Senegal
1 2
4
6
8
10
Number of components
0.7
0.75
0.8
0.85
0.9
0.95
1
Accuracy
0
2
4
6
8
10
12
# Misclassified
a
b
c
Fig. 7.27 PLS-DA prediction of the “Acacia seyal” class belonging of Dataset 3. a shows the
prediction error of the dummy y variable. b shows the predicted value of the two groups colored
according to class (Acacia seyal is red, and Acacia senegal is blue). The red line indicates the
classification threshold. c shows the prediction accuracy as a function of components
Table 7.1 Confusion table
for the Acacia seyal PLS-DA
prediction
n = 260
Actual Acacia
seyal
n = 70
Actual Acacia
senegal
n = 190
Predicted Acacia
seyal
True positives (TP)
67
False positives
(FP)
0
Predicted Acacia
senegal
False negatives
(FN)
3
True negatives
(TN)
190