

7 NIR Data Exploration and Regression by Chemometrics—A Primer
151
SSQ
t f · p f
=
n
m
t f · p f
2
n,m
(7.23)
When combined, Eqs. 7.22 and 7.23 yield the percentage of explained variance
for a given component f as:
Variance(f) =
SSQ
t f · p f
SSQ(X)
· 100%
(7.24)
It is customary, when reporting PCA results, to state how much variance the
individual components explain. The explained variance by the PCs is often indicated
on the PCA score plot axes, where, e.g., “PC1 (50%)” means that PC1 explains fifty
percent of the total systematic variance in the dataset.
7.4.3 Application of PCA to NIR Spectra
The application of PCA to spectroscopic data is best illustrated by an example.
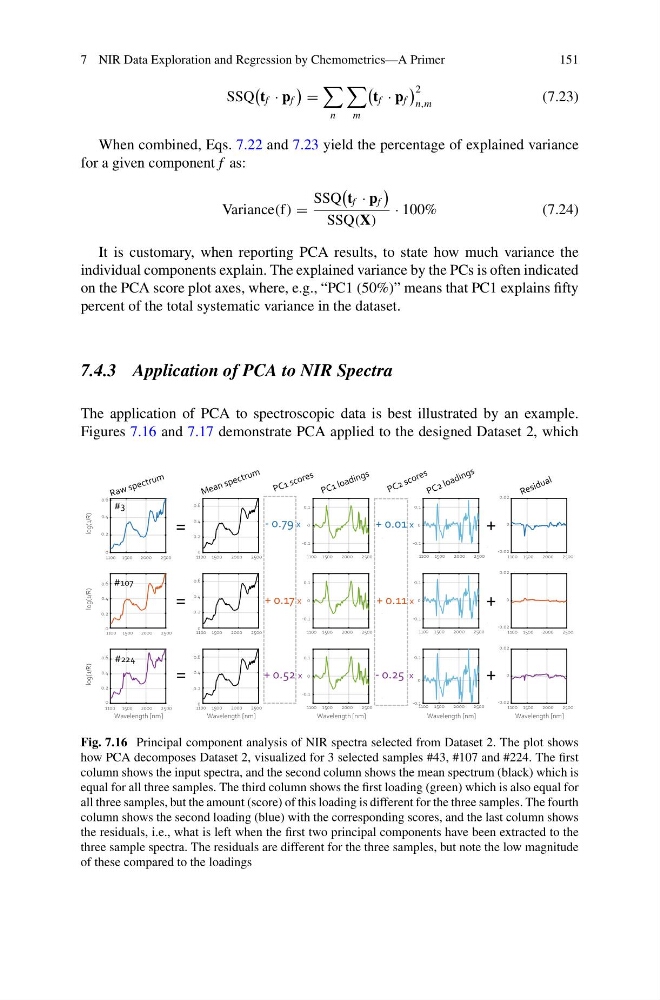
Figures 7.16 and 7.17 demonstrate PCA applied to the designed Dataset 2, which
1100 1500 2000
2500
0
0.2
0.4
0.6
log(1/R)
1100 1500 2000
2500
0
0.2
0.4
0.6
log(1/R)
1100 1500
2000
2500
Wavelength [nm]
0
0.2
0.4
0.6
log(1/R)
1100 1500
2000
2500
0
0.2
0.4
0.6
1100 1500
2000
2500
0
0.2
0.4
0.6
1100 1500
2000
2500
Wavelength [nm]
0
0.2
0.4
0.6
1100 1500
2000
2500
-0.1
0
0.1
1100 1500
2000
2500
-0.1
0
0.1
1100 1500
2000
2500
Wavelength [nm]
-0.1
0
0.1
-
-
-
1100 1500
2000
2500
-0.1
0
0.1
1100 1500
2000
2500
-0.1
0
0.1
1100 1500
2000
2500
Wavelength [nm]
-0.1
0
0.1
-
-
-
=
=
=
+
+
+
- 0.79 x
+ 0.17 x
+ 0.52 x
+ 0.01 x
+ 0.11 x
- 0.25 x
#3
#107
#224
1100 1500
2000
2500
-0.02
0
0.02
1100 1500
2000
2500
-0.02
0
0.02
1100 1500
2000
2500
Wavelength [nm]
-0.02
0
0.02
Fig. 7.16 Principal component analysis of NIR spectra selected from Dataset 2. The plot shows
how PCA decomposes Dataset 2, visualized for 3 selected samples #43, #107 and #224. The first
column shows the input spectra, and the second column shows the mean spectrum (black) which is
equal for all three samples. The third column shows the first loading (green) which is also equal for
all three samples, but the amount (score) of this loading is different for the three samples. The fourth
column shows the second loading (blue) with the corresponding scores, and the last column shows
the residuals, i.e., what is left when the first two principal components have been extracted to the
three sample spectra. The residuals are different for the three samples, but note the low magnitude
of these compared to the loadings
151
SSQ
t f · p f
=
n
m
t f · p f
2
n,m
(7.23)
When combined, Eqs. 7.22 and 7.23 yield the percentage of explained variance
for a given component f as:
Variance(f) =
SSQ
t f · p f
SSQ(X)
· 100%
(7.24)
It is customary, when reporting PCA results, to state how much variance the
individual components explain. The explained variance by the PCs is often indicated
on the PCA score plot axes, where, e.g., “PC1 (50%)” means that PC1 explains fifty
percent of the total systematic variance in the dataset.
7.4.3 Application of PCA to NIR Spectra
The application of PCA to spectroscopic data is best illustrated by an example.
Figures 7.16 and 7.17 demonstrate PCA applied to the designed Dataset 2, which
1100 1500 2000
2500
0
0.2
0.4
0.6
log(1/R)
1100 1500 2000
2500
0
0.2
0.4
0.6
log(1/R)
1100 1500
2000
2500
Wavelength [nm]
0
0.2
0.4
0.6
log(1/R)
1100 1500
2000
2500
0
0.2
0.4
0.6
1100 1500
2000
2500
0
0.2
0.4
0.6
1100 1500
2000
2500
Wavelength [nm]
0
0.2
0.4
0.6
1100 1500
2000
2500
-0.1
0
0.1
1100 1500
2000
2500
-0.1
0
0.1
1100 1500
2000
2500
Wavelength [nm]
-0.1
0
0.1
-
-
-
1100 1500
2000
2500
-0.1
0
0.1
1100 1500
2000
2500
-0.1
0
0.1
1100 1500
2000
2500
Wavelength [nm]
-0.1
0
0.1
-
-
-
=
=
=
+
+
+
- 0.79 x
+ 0.17 x
+ 0.52 x
+ 0.01 x
+ 0.11 x
- 0.25 x
#3
#107
#224
1100 1500
2000
2500
-0.02
0
0.02
1100 1500
2000
2500
-0.02
0
0.02
1100 1500
2000
2500
Wavelength [nm]
-0.02
0
0.02
Fig. 7.16 Principal component analysis of NIR spectra selected from Dataset 2. The plot shows
how PCA decomposes Dataset 2, visualized for 3 selected samples #43, #107 and #224. The first
column shows the input spectra, and the second column shows the mean spectrum (black) which is
equal for all three samples. The third column shows the first loading (green) which is also equal for
all three samples, but the amount (score) of this loading is different for the three samples. The fourth
column shows the second loading (blue) with the corresponding scores, and the last column shows
the residuals, i.e., what is left when the first two principal components have been extracted to the
three sample spectra. The residuals are different for the three samples, but note the low magnitude
of these compared to the loadings