

7 NIR Data Exploration and Regression by Chemometrics—A Primer
143
7.2.4 Outro
The pre-processing methods mentioned here, and sometimes a larger selection of
additional methods, are always included in chemometric software. However, great
care must be taken in the selection of pre-processing methods and especially when
they are used to optimize quantitative results. No matter how elaborate the portfolio
of methods, the NIR spectroscopists time is typically much better spent in getting
familiar with the spectral data and target variables (plotting spectra with intelligent
use of colors, generating ratio plots, covarygrams, etc.) than by spending time investigating more complex pre-processing procedures. It has been estimated that the
maximum regression improvement of any pre-processed model when compared to
the global model is approximately 25% in RMSE. This is hardly what makes the
difference in multivariate feasibility studies, and it is thus recommendable to select
pre-processing in order to achieve parsimonious, interpretable models [11].
7.3 Unscrambling Spectral Mixtures by Self-Modeling
Multivariate Curve Resolution (MCR)
Ideally, we want to resolve complex mixture spectra into contributions
of pure analyte spectra (S) weighted by their concentrations (C):
X = C · S
T
+ E
If several analytes with varying concentrations are present in a mixture, the pure
spectra and the associated relative concentrations can be estimated under certain
conditions. The method used is called self-modeling curve resolution [18] or just
multivariate curve resolution (MCR) [19].
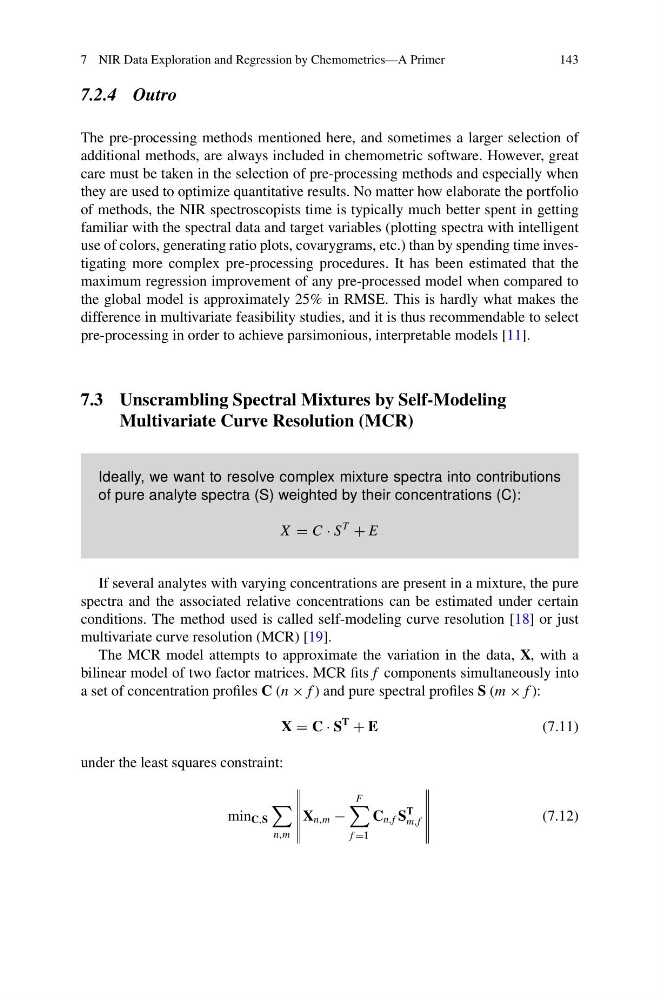
The MCR model attempts to approximate the variation in the data, X, with a
bilinear model of two factor matrices. MCR fits f components simultaneously into
a set of concentration profiles C (n × f ) and pure spectral profiles S (m × f ):
X = C · S
T
+ E
(7.11)
under the least squares constraint:
min C,S
n,m
X n,m −
F
f =1
C n,f S
T
m,f
(7.12)
143
7.2.4 Outro
The pre-processing methods mentioned here, and sometimes a larger selection of
additional methods, are always included in chemometric software. However, great
care must be taken in the selection of pre-processing methods and especially when
they are used to optimize quantitative results. No matter how elaborate the portfolio
of methods, the NIR spectroscopists time is typically much better spent in getting
familiar with the spectral data and target variables (plotting spectra with intelligent
use of colors, generating ratio plots, covarygrams, etc.) than by spending time investigating more complex pre-processing procedures. It has been estimated that the
maximum regression improvement of any pre-processed model when compared to
the global model is approximately 25% in RMSE. This is hardly what makes the
difference in multivariate feasibility studies, and it is thus recommendable to select
pre-processing in order to achieve parsimonious, interpretable models [11].
7.3 Unscrambling Spectral Mixtures by Self-Modeling
Multivariate Curve Resolution (MCR)
Ideally, we want to resolve complex mixture spectra into contributions
of pure analyte spectra (S) weighted by their concentrations (C):
X = C · S
T
+ E
If several analytes with varying concentrations are present in a mixture, the pure
spectra and the associated relative concentrations can be estimated under certain
conditions. The method used is called self-modeling curve resolution [18] or just
multivariate curve resolution (MCR) [19].
The MCR model attempts to approximate the variation in the data, X, with a
bilinear model of two factor matrices. MCR fits f components simultaneously into
a set of concentration profiles C (n × f ) and pure spectral profiles S (m × f ):
X = C · S
T
+ E
(7.11)
under the least squares constraint:
min C,S
n,m
X n,m −
F
f =1
C n,f S
T
m,f
(7.12)