

7 NIR Data Exploration and Regression by Chemometrics—A Primer
141
in this window must be decided prior to analysis. It can be shown that the highest
derivative that can be calculated is equal to the polynomial order incurred with the
smoothing.
7.2.3 Application of Pre-processing to NIR Spectra
There is no simple answer to the question “which pre-processing method (and what
configuration) suits a given data type.” It will all depend on the data, data collection
and purpose of the analysis. However, the primary target of pre-processing is clear:
a linearization of the spectra to match the Lambert–Beer law.
To demonstrate this, Dataset 1 is used. Beforehand, it is known that the primary
information about the degree of esterification (%DE) is located at 2244 nm. In
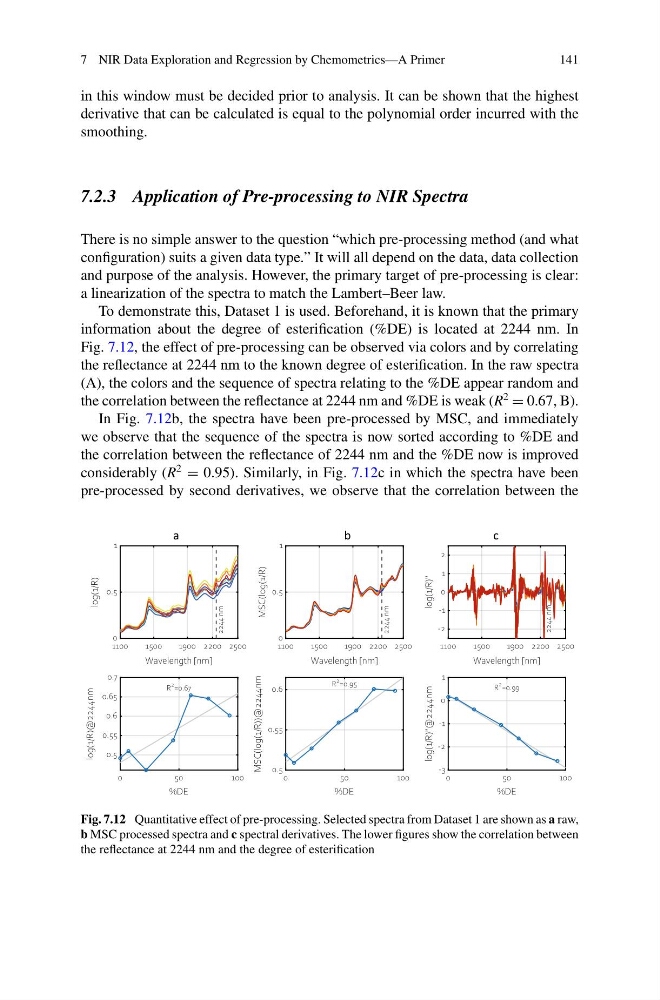
Fig. 7.12, the effect of pre-processing can be observed via colors and by correlating
the reflectance at 2244 nm to the known degree of esterification. In the raw spectra
(A), the colors and the sequence of spectra relating to the %DE appear random and
the correlation between the reflectance at 2244 nm and %DE is weak (R
2
= 0.67, B).
In Fig. 7.12b, the spectra have been pre-processed by MSC, and immediately
we observe that the sequence of the spectra is now sorted according to %DE and
the correlation between the reflectance of 2244 nm and the %DE now is improved
considerably (R
2
= 0.95). Similarly, in Fig. 7.12c in which the spectra have been
pre-processed by second derivatives, we observe that the correlation between the
1100
1500
1900 2200 2500
Wavelength [nm]
0
0.5
1
log(1/R)
2244 nm
0
50
100
%DE
0.5
0.55
0.6
0.65
0.7
log(1/R)@2244nm
R
2 =0.67
1100
1500
1900 2200 2500
Wavelength [nm]
0
0.5
1
MSC(log(1/R)
2244
nm
0
50
100
%DE
0.5
0.55
0.6
MSC(log(1/R))@2244nm
R
2 =0.95
1100
1500
1900 2200 2500
Wavelength [nm]
-2
-1
0
1
2
log(1/R)''
2244 nm
0
50
100
%DE
-3
-2
-1
0
1
log(1/R)''@2244nm
R
2 =0.99
a
b
c
Fig. 7.12 Quantitative effect of pre-processing. Selected spectra from Dataset 1 are shown as a raw,
b MSC processed spectra and c spectral derivatives. The lower figures show the correlation between
the reflectance at 2244 nm and the degree of esterification
141
in this window must be decided prior to analysis. It can be shown that the highest
derivative that can be calculated is equal to the polynomial order incurred with the
smoothing.
7.2.3 Application of Pre-processing to NIR Spectra
There is no simple answer to the question “which pre-processing method (and what
configuration) suits a given data type.” It will all depend on the data, data collection
and purpose of the analysis. However, the primary target of pre-processing is clear:
a linearization of the spectra to match the Lambert–Beer law.
To demonstrate this, Dataset 1 is used. Beforehand, it is known that the primary
information about the degree of esterification (%DE) is located at 2244 nm. In
Fig. 7.12, the effect of pre-processing can be observed via colors and by correlating
the reflectance at 2244 nm to the known degree of esterification. In the raw spectra
(A), the colors and the sequence of spectra relating to the %DE appear random and
the correlation between the reflectance at 2244 nm and %DE is weak (R
2
= 0.67, B).
In Fig. 7.12b, the spectra have been pre-processed by MSC, and immediately
we observe that the sequence of the spectra is now sorted according to %DE and
the correlation between the reflectance of 2244 nm and the %DE now is improved
considerably (R
2
= 0.95). Similarly, in Fig. 7.12c in which the spectra have been
pre-processed by second derivatives, we observe that the correlation between the
1100
1500
1900 2200 2500
Wavelength [nm]
0
0.5
1
log(1/R)
2244 nm
0
50
100
%DE
0.5
0.55
0.6
0.65
0.7
log(1/R)@2244nm
R
2 =0.67
1100
1500
1900 2200 2500
Wavelength [nm]
0
0.5
1
MSC(log(1/R)
2244
nm
0
50
100
%DE
0.5
0.55
0.6
MSC(log(1/R))@2244nm
R
2 =0.95
1100
1500
1900 2200 2500
Wavelength [nm]
-2
-1
0
1
2
log(1/R)''
2244 nm
0
50
100
%DE
-3
-2
-1
0
1
log(1/R)''@2244nm
R
2 =0.99
a
b
c
Fig. 7.12 Quantitative effect of pre-processing. Selected spectra from Dataset 1 are shown as a raw,
b MSC processed spectra and c spectral derivatives. The lower figures show the correlation between
the reflectance at 2244 nm and the degree of esterification