

138
K. M. Sørensen et al.
400
1000
1500
2000
2500
Wavelength [nm]
0
0.2
0.4
0.6
0.8
1
1.2
1.4
log(1/R)
Amorph
Fine
Coarse
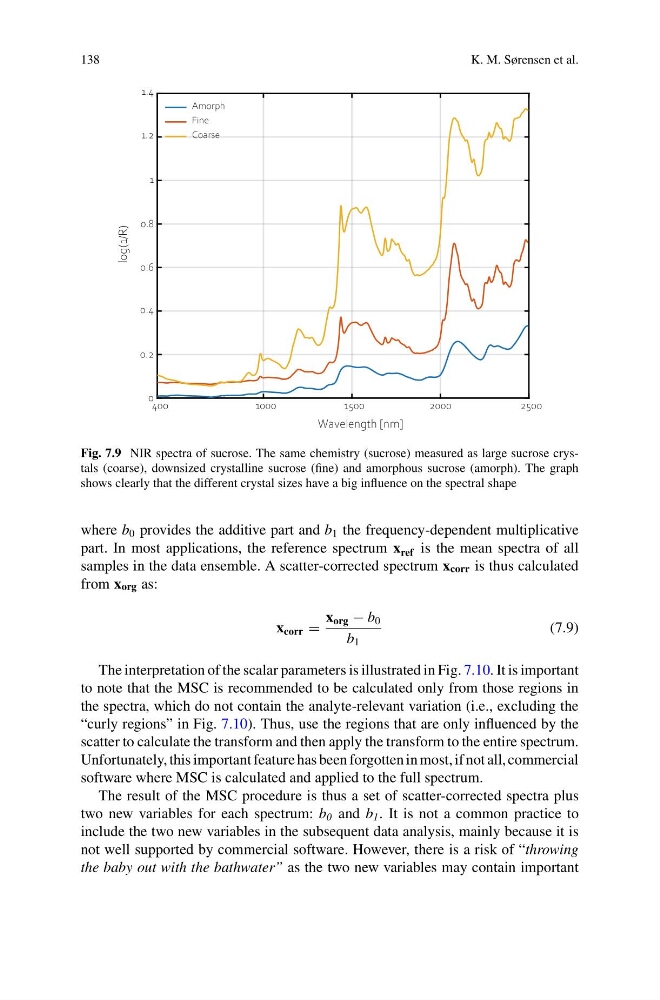
Fig. 7.9 NIR spectra of sucrose. The same chemistry (sucrose) measured as large sucrose crystals (coarse), downsized crystalline sucrose (fine) and amorphous sucrose (amorph). The graph
shows clearly that the different crystal sizes have a big influence on the spectral shape
where b 0 provides the additive part and b 1 the frequency-dependent multiplicative
part. In most applications, the reference spectrum x ref is the mean spectra of all
samples in the data ensemble. A scatter-corrected spectrum x corr is thus calculated
from x org as:
x corr =
x org − b 0
b 1
(7.9)
The interpretation of the scalar parameters is illustrated in Fig. 7.10. It is important
to note that the MSC is recommended to be calculated only from those regions in
the spectra, which do not contain the analyte-relevant variation (i.e., excluding the
“curly regions” in Fig. 7.10). Thus, use the regions that are only influenced by the
scatter to calculate the transform and then apply the transform to the entire spectrum.
Unfortunately, this important feature has been forgotten in most, if not all, commercial
software where MSC is calculated and applied to the full spectrum.
The result of the MSC procedure is thus a set of scatter-corrected spectra plus
two new variables for each spectrum: b 0 and b 1 . It is not a common practice to
include the two new variables in the subsequent data analysis, mainly because it is
not well supported by commercial software. However, there is a risk of “throwing
the baby out with the bathwater” as the two new variables may contain important
K. M. Sørensen et al.
400
1000
1500
2000
2500
Wavelength [nm]
0
0.2
0.4
0.6
0.8
1
1.2
1.4
log(1/R)
Amorph
Fine
Coarse
Fig. 7.9 NIR spectra of sucrose. The same chemistry (sucrose) measured as large sucrose crystals (coarse), downsized crystalline sucrose (fine) and amorphous sucrose (amorph). The graph
shows clearly that the different crystal sizes have a big influence on the spectral shape
where b 0 provides the additive part and b 1 the frequency-dependent multiplicative
part. In most applications, the reference spectrum x ref is the mean spectra of all
samples in the data ensemble. A scatter-corrected spectrum x corr is thus calculated
from x org as:
x corr =
x org − b 0
b 1
(7.9)
The interpretation of the scalar parameters is illustrated in Fig. 7.10. It is important
to note that the MSC is recommended to be calculated only from those regions in
the spectra, which do not contain the analyte-relevant variation (i.e., excluding the
“curly regions” in Fig. 7.10). Thus, use the regions that are only influenced by the
scatter to calculate the transform and then apply the transform to the entire spectrum.
Unfortunately, this important feature has been forgotten in most, if not all, commercial
software where MSC is calculated and applied to the full spectrum.
The result of the MSC procedure is thus a set of scatter-corrected spectra plus
two new variables for each spectrum: b 0 and b 1 . It is not a common practice to
include the two new variables in the subsequent data analysis, mainly because it is
not well supported by commercial software. However, there is a risk of “throwing
the baby out with the bathwater” as the two new variables may contain important