

136
K. M. Sørensen et al.
and Lorentz–Mie scattering which is predominant when the particle sizes are larger
than the wavelength.
There exists a forest of pre-processing techniques for NIR spectra to alleviate
errors introduced by scattering. They can be roughly divided into two groups: scatter
correction methods and spectral derivatives. In this chapter, we will only briefly
introduce the multiplicative scatter correction (MSC) method [12, 13] and the secondderivative spectra. For almost any practical application in which the need is to analyze
less than a few hundred NIR spectra, these two pre-processing methods are fit for
purpose. Selection of more advanced spectral pre-processing methods to optimize
the quantitative results is generally not advisable unless many more sample spectra
and expert domain knowledge are present.
Before considering pre-processing, it is always worthwhile to do a simple visual
inspection of the data. The aim should be to inspect the spectral variations and
to observe if there exist faulty measurements or if parts of the spectral region are
noisy/saturated and no sample information is to be expected. In both cases, such
spectral data (or spectral ranges) should be removed prior to the application of
pre-processing and chemometrics since they might deteriorate the result. When
applied correctly, NIR spectroscopy is a very robust measurement technique and
faulty measurements thus rarely occur. Typically, it will be the results of the
occasional poor sample presentation. Noisy variables, on the other hand, are a
frequent phenomenon in NIR spectroscopy, when the sample is absorbing too
strong, which often occurs in the long-wavelength NIR region, where the molar
extinction coefficients (molecular absorptivity) are high.
In addition, some spectrometers introduce artifacts in the spectra that might be
hard to spot without a visual inspection of the data. This includes cutting or truncating absorbance values above a certain threshold (typically 3 absorbance units and
above) or detector overload resulting in strange reporting values. Such phenomena
are typically seen in samples containing high amounts of water, where the OH information can be very distorted, unless great care is taken. These artifacts are poison for
most pre-processing techniques and must be addressed before any other handling of
the data.
The spectral region covered by NIR spectrometers is a pragmatic compromise
between optical materials (e.g., quartz), light sources (e.g., halogen bulb) and detector
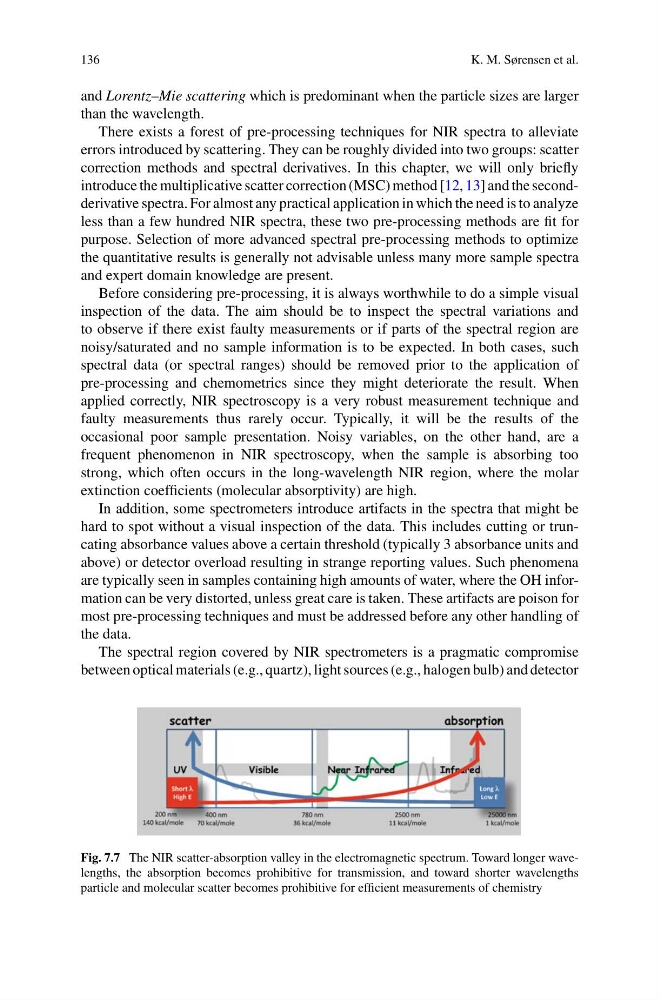
Fig. 7.7 The NIR scatter-absorption valley in the electromagnetic spectrum. Toward longer wavelengths, the absorption becomes prohibitive for transmission, and toward shorter wavelengths
particle and molecular scatter becomes prohibitive for efficient measurements of chemistry
K. M. Sørensen et al.
and Lorentz–Mie scattering which is predominant when the particle sizes are larger
than the wavelength.
There exists a forest of pre-processing techniques for NIR spectra to alleviate
errors introduced by scattering. They can be roughly divided into two groups: scatter
correction methods and spectral derivatives. In this chapter, we will only briefly
introduce the multiplicative scatter correction (MSC) method [12, 13] and the secondderivative spectra. For almost any practical application in which the need is to analyze
less than a few hundred NIR spectra, these two pre-processing methods are fit for
purpose. Selection of more advanced spectral pre-processing methods to optimize
the quantitative results is generally not advisable unless many more sample spectra
and expert domain knowledge are present.
Before considering pre-processing, it is always worthwhile to do a simple visual
inspection of the data. The aim should be to inspect the spectral variations and
to observe if there exist faulty measurements or if parts of the spectral region are
noisy/saturated and no sample information is to be expected. In both cases, such
spectral data (or spectral ranges) should be removed prior to the application of
pre-processing and chemometrics since they might deteriorate the result. When
applied correctly, NIR spectroscopy is a very robust measurement technique and
faulty measurements thus rarely occur. Typically, it will be the results of the
occasional poor sample presentation. Noisy variables, on the other hand, are a
frequent phenomenon in NIR spectroscopy, when the sample is absorbing too
strong, which often occurs in the long-wavelength NIR region, where the molar
extinction coefficients (molecular absorptivity) are high.
In addition, some spectrometers introduce artifacts in the spectra that might be
hard to spot without a visual inspection of the data. This includes cutting or truncating absorbance values above a certain threshold (typically 3 absorbance units and
above) or detector overload resulting in strange reporting values. Such phenomena
are typically seen in samples containing high amounts of water, where the OH information can be very distorted, unless great care is taken. These artifacts are poison for
most pre-processing techniques and must be addressed before any other handling of
the data.
The spectral region covered by NIR spectrometers is a pragmatic compromise
between optical materials (e.g., quartz), light sources (e.g., halogen bulb) and detector
Fig. 7.7 The NIR scatter-absorption valley in the electromagnetic spectrum. Toward longer wavelengths, the absorption becomes prohibitive for transmission, and toward shorter wavelengths
particle and molecular scatter becomes prohibitive for efficient measurements of chemistry