

6 Two-Dimensional Correlation Spectroscopy
123
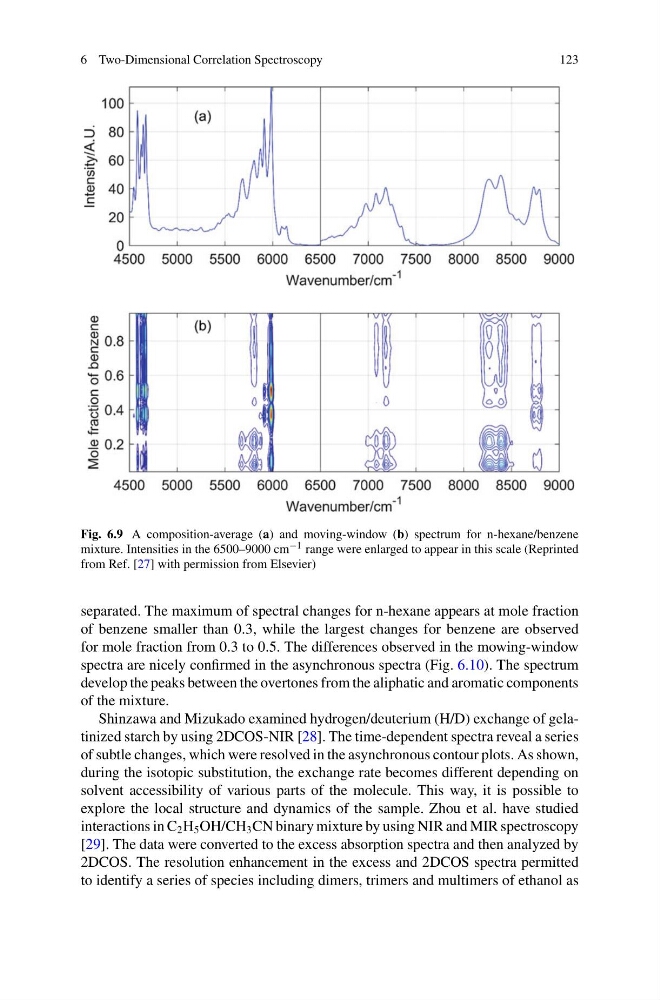
Fig. 6.9 A composition-average (a) and moving-window (b) spectrum for n-hexane/benzene
mixture. Intensities in the 6500–9000 cm −1 range were enlarged to appear in this scale (Reprinted
from Ref. [27] with permission from Elsevier)
separated. The maximum of spectral changes for n-hexane appears at mole fraction
of benzene smaller than 0.3, while the largest changes for benzene are observed
for mole fraction from 0.3 to 0.5. The differences observed in the mowing-window
spectra are nicely confirmed in the asynchronous spectra (Fig. 6.10). The spectrum
develop the peaks between the overtones from the aliphatic and aromatic components
of the mixture.
Shinzawa and Mizukado examined hydrogen/deuterium (H/D) exchange of gelatinized starch by using 2DCOS-NIR [28]. The time-dependent spectra reveal a series
of subtle changes, which were resolved in the asynchronous contour plots. As shown,
during the isotopic substitution, the exchange rate becomes different depending on
solvent accessibility of various parts of the molecule. This way, it is possible to
explore the local structure and dynamics of the sample. Zhou et al. have studied
interactions in C 2 H 5 OH/CH 3 CN binary mixture by using NIR and MIR spectroscopy
[29]. The data were converted to the excess absorption spectra and then analyzed by
2DCOS. The resolution enhancement in the excess and 2DCOS spectra permitted
to identify a series of species including dimers, trimers and multimers of ethanol as
123
Fig. 6.9 A composition-average (a) and moving-window (b) spectrum for n-hexane/benzene
mixture. Intensities in the 6500–9000 cm −1 range were enlarged to appear in this scale (Reprinted
from Ref. [27] with permission from Elsevier)
separated. The maximum of spectral changes for n-hexane appears at mole fraction
of benzene smaller than 0.3, while the largest changes for benzene are observed
for mole fraction from 0.3 to 0.5. The differences observed in the mowing-window
spectra are nicely confirmed in the asynchronous spectra (Fig. 6.10). The spectrum
develop the peaks between the overtones from the aliphatic and aromatic components
of the mixture.
Shinzawa and Mizukado examined hydrogen/deuterium (H/D) exchange of gelatinized starch by using 2DCOS-NIR [28]. The time-dependent spectra reveal a series
of subtle changes, which were resolved in the asynchronous contour plots. As shown,
during the isotopic substitution, the exchange rate becomes different depending on
solvent accessibility of various parts of the molecule. This way, it is possible to
explore the local structure and dynamics of the sample. Zhou et al. have studied
interactions in C 2 H 5 OH/CH 3 CN binary mixture by using NIR and MIR spectroscopy
[29]. The data were converted to the excess absorption spectra and then analyzed by
2DCOS. The resolution enhancement in the excess and 2DCOS spectra permitted
to identify a series of species including dimers, trimers and multimers of ethanol as