

reaction 2 (i.e. condition E F > E F (Ag
+
/Ag)) starts at ~ –70 mV cathodic voltage. The
current-time signal is shown in Fig. 3 at –100 mV applied bias. The time for
establishing a quantum point contact (and related current increase) is shown in the
zoomed window. In can be seen that for a certain period of time, after –100 mV were
applied, the current remains low and constant and no increase was observed (step
2 in Fig. 3). This induction period (or time lag) can be explained only by a slow
phase formation (nucleation) of the critical nucleus. In this way using the Atomic
Switch approach we were also able to distinguish between different kinetic limitations, in this case that nucleation instead of charge transfer or ion diffusion is rate
limiting.
Increasing the magnitude of the applied voltage resulted in qualitatively same
current time responses, where only the induction time (time lag region) shortens. In
this experiment, the applied voltage was varied between –100 and –600 mV and t s
has been recorded. The same experiments were repeated at different temperatures in
order to determine the activation energy of the process. The results of the performed
analysis are shown in Fig. 6.
As it can be seen in Fig. 6a the semi-logarithmic plot shows not a continuous but a
discrete character showing two distinctive regions. At that point we have to account
that approaching nano- and/or sub-nano dimensions the number of ions/atoms we
exchange with the solid electrolyte is reduced below ~20. Thus, instead of the
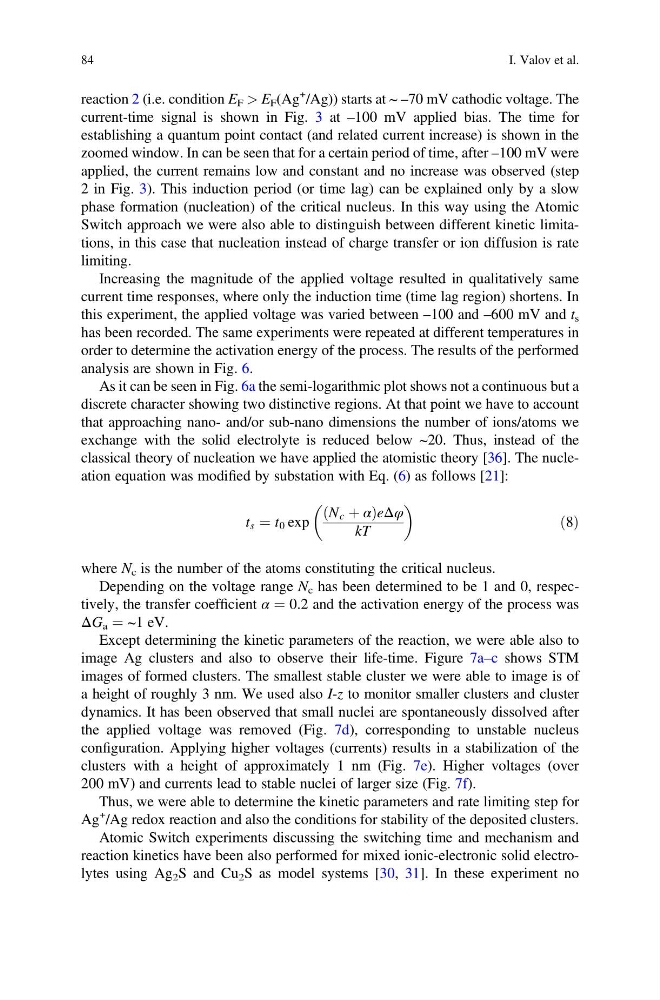
classical theory of nucleation we have applied the atomistic theory [36]. The nucleation equation was modified by substation with Eq. (6) as follows [21]:
t s ¼ t 0 exp
N c þ α
ð
ÞeΔφ
kT
ð8Þ
where N c is the number of the atoms constituting the critical nucleus.
Depending on the voltage range N c has been determined to be 1 and 0, respectively, the transfer coefficient α ¼ 0.2 and the activation energy of the process was
ΔG a ¼ ~1 eV.
Except determining the kinetic parameters of the reaction, we were able also to
image Ag clusters and also to observe their life-time. Figure 7a–c shows STM
images of formed clusters. The smallest stable cluster we were able to image is of
a height of roughly 3 nm. We used also I-z to monitor smaller clusters and cluster
dynamics. It has been observed that small nuclei are spontaneously dissolved after
the applied voltage was removed (Fig. 7d), corresponding to unstable nucleus
configuration. Applying higher voltages (currents) results in a stabilization of the
clusters with a height of approximately 1 nm (Fig. 7e). Higher voltages (over
200 mV) and currents lead to stable nuclei of larger size (Fig. 7f).
Thus, we were able to determine the kinetic parameters and rate limiting step for
Ag
+
/Ag redox reaction and also the conditions for stability of the deposited clusters.
Atomic Switch experiments discussing the switching time and mechanism and
reaction kinetics have been also performed for mixed ionic-electronic solid electrolytes using Ag 2 S and Cu 2 S as model systems [30, 31]. In these experiment no
84
I. Valov et al.
+
/Ag)) starts at ~ –70 mV cathodic voltage. The
current-time signal is shown in Fig. 3 at –100 mV applied bias. The time for
establishing a quantum point contact (and related current increase) is shown in the
zoomed window. In can be seen that for a certain period of time, after –100 mV were
applied, the current remains low and constant and no increase was observed (step
2 in Fig. 3). This induction period (or time lag) can be explained only by a slow
phase formation (nucleation) of the critical nucleus. In this way using the Atomic
Switch approach we were also able to distinguish between different kinetic limitations, in this case that nucleation instead of charge transfer or ion diffusion is rate
limiting.
Increasing the magnitude of the applied voltage resulted in qualitatively same
current time responses, where only the induction time (time lag region) shortens. In
this experiment, the applied voltage was varied between –100 and –600 mV and t s
has been recorded. The same experiments were repeated at different temperatures in
order to determine the activation energy of the process. The results of the performed
analysis are shown in Fig. 6.
As it can be seen in Fig. 6a the semi-logarithmic plot shows not a continuous but a
discrete character showing two distinctive regions. At that point we have to account
that approaching nano- and/or sub-nano dimensions the number of ions/atoms we
exchange with the solid electrolyte is reduced below ~20. Thus, instead of the
classical theory of nucleation we have applied the atomistic theory [36]. The nucleation equation was modified by substation with Eq. (6) as follows [21]:
t s ¼ t 0 exp
N c þ α
ð
ÞeΔφ
kT
ð8Þ
where N c is the number of the atoms constituting the critical nucleus.
Depending on the voltage range N c has been determined to be 1 and 0, respectively, the transfer coefficient α ¼ 0.2 and the activation energy of the process was
ΔG a ¼ ~1 eV.
Except determining the kinetic parameters of the reaction, we were able also to
image Ag clusters and also to observe their life-time. Figure 7a–c shows STM
images of formed clusters. The smallest stable cluster we were able to image is of
a height of roughly 3 nm. We used also I-z to monitor smaller clusters and cluster
dynamics. It has been observed that small nuclei are spontaneously dissolved after
the applied voltage was removed (Fig. 7d), corresponding to unstable nucleus
configuration. Applying higher voltages (currents) results in a stabilization of the
clusters with a height of approximately 1 nm (Fig. 7e). Higher voltages (over
200 mV) and currents lead to stable nuclei of larger size (Fig. 7f).
Thus, we were able to determine the kinetic parameters and rate limiting step for
Ag
+
/Ag redox reaction and also the conditions for stability of the deposited clusters.
Atomic Switch experiments discussing the switching time and mechanism and
reaction kinetics have been also performed for mixed ionic-electronic solid electrolytes using Ag 2 S and Cu 2 S as model systems [30, 31]. In these experiment no
84
I. Valov et al.