

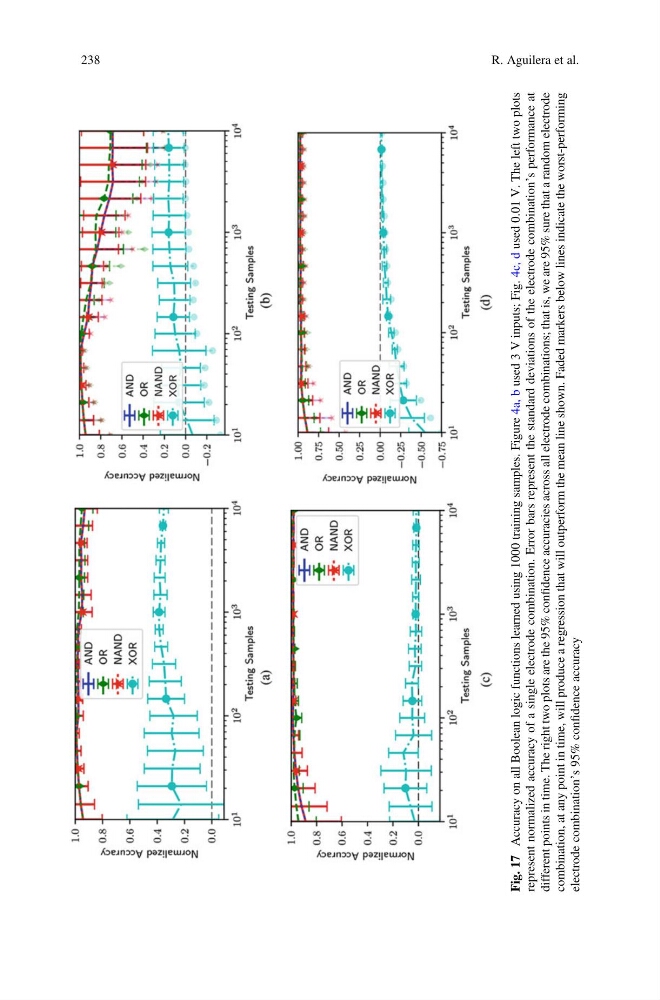
Fig. 17
Accuracy on all Boolean logic functions learned using 1000 training samples. Figure 4a, b used 3 V inputs; Fig. 4c, d used 0.01 V. The left two plots
represent normalized accuracy of a single electrode combination. Error bars represent the standard deviations of the electrode combination’s performance at
different points in time. The right two plots are the 95% confidence accuracies across all electrode combinations; that is, we are 95% sure that a random electrode
combination, at any point in time, will produce a regression that will outperform the mean line shown. Faded markers below lines indicate the worst-performing
electrode combination’s 95% confidence accuracy
238
R. Aguilera et al.
Accuracy on all Boolean logic functions learned using 1000 training samples. Figure 4a, b used 3 V inputs; Fig. 4c, d used 0.01 V. The left two plots
represent normalized accuracy of a single electrode combination. Error bars represent the standard deviations of the electrode combination’s performance at
different points in time. The right two plots are the 95% confidence accuracies across all electrode combinations; that is, we are 95% sure that a random electrode
combination, at any point in time, will produce a regression that will outperform the mean line shown. Faded markers below lines indicate the worst-performing
electrode combination’s 95% confidence accuracy
238
R. Aguilera et al.