

conductivity. Hence, the resistance of Cu 2 S increases with an increase of Cu concentration [13]. However, such change in resistance of Cu 2 S, due to local Cu
+ enrichment
at the subsurface, can be negligible compared to the resistance of the nanogap of a
Cu 2 S gap-type atomic switch, where a Cu 2 S mixed conductor on a Cu electrode and a
counter Pt electrode are opposed in the scanning tunneling microscope. The conductance measurements were carried out in vacuum conditions (10
–7 Pa) and in air, at
different temperatures controlled by indirect resistive heating. Details of the sample
preparation and experimental conditions are presented in Ref. [3].
The Cu 2 S synapse operation obtained in vacuum for input voltage pulses with
varying amplitude (V ¼ 100, 150 mV), width (W ¼ 50, 500 ms) and intervals (T ¼ 1,
10 s) are shown in Fig. 7. For T ¼ 10 s, the conductance almost reached ~1G 0 for all
the input pulses of 150 mV and 500 ms, but decayed spontaneously in the interval
between the pulses, indicating the STM mode (Fig. 7a). When T was decreased to
1 s, a long-lived transition to the higher conductance state (! G 0 for at least 20 s) was
achieved after ten inputs of the same pulse, which corresponds to the LTM mode
(Fig. 7b). When the pulse amplitude was decreased to 100 mV keeping interval at
10 s (Fig. 7c), the SM mode was observed at the 6th pulse prior to observation of the
first STM state at the 8th pulse. For the same pulse, when T was decreased to 1 s
(Fig. 7e) the first STM mode was achieved after 5 input pulses and the LTM mode
was achieved after 11 input pulses. Further, if the width was decreased to 50 ms for
the input as in Fig. 7a, the first STM state was achieved after 10 input pulses and a
LTM state was not achieved even after 30 input pulses. Figure 7f shows the
magnified view of Fig. 7c as indicated by the dashed rectangular box, in which the
conductance curves of the successive STM modes are fitted with the exponential
decay function y ¼ y 0 + A e
–t/τ , where y is the conductance, y 0 is the conductance
offset, A is the fit constant, τ is the time constant, and t is the time after each input
pulse application. Similar analysis has also been presented in the previous subsection
in the context of Ag 2 S system. Such exponential functions are most commonly used
for the quantitative description of retention in human memory [12]. Similar to the
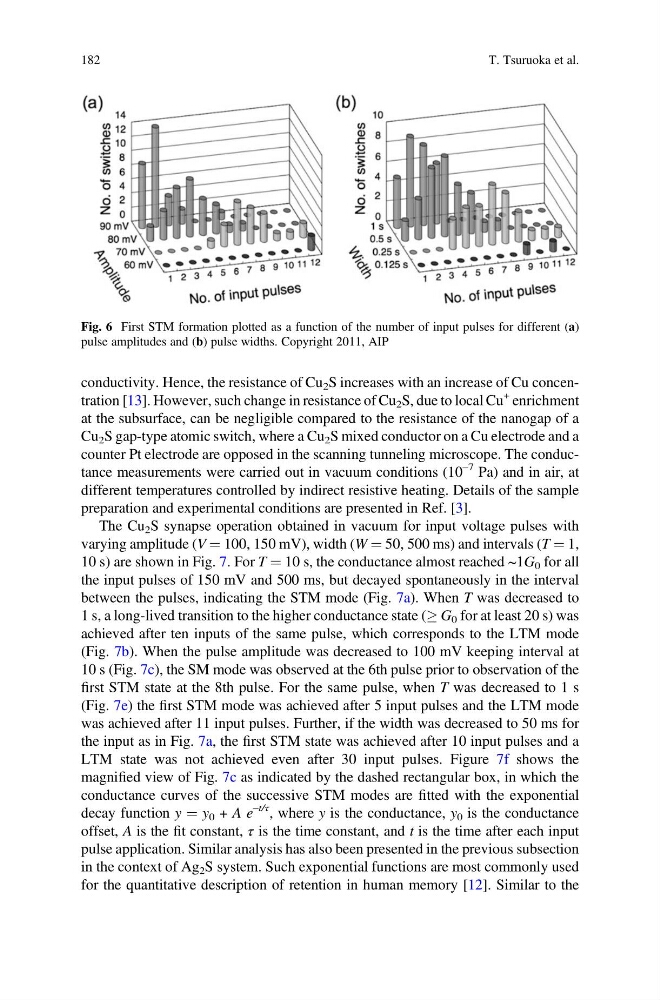
Fig. 6 First STM formation plotted as a function of the number of input pulses for different (a)
pulse amplitudes and (b) pulse widths. Copyright 2011, AIP
182
T. Tsuruoka et al.
+ enrichment
at the subsurface, can be negligible compared to the resistance of the nanogap of a
Cu 2 S gap-type atomic switch, where a Cu 2 S mixed conductor on a Cu electrode and a
counter Pt electrode are opposed in the scanning tunneling microscope. The conductance measurements were carried out in vacuum conditions (10
–7 Pa) and in air, at
different temperatures controlled by indirect resistive heating. Details of the sample
preparation and experimental conditions are presented in Ref. [3].
The Cu 2 S synapse operation obtained in vacuum for input voltage pulses with
varying amplitude (V ¼ 100, 150 mV), width (W ¼ 50, 500 ms) and intervals (T ¼ 1,
10 s) are shown in Fig. 7. For T ¼ 10 s, the conductance almost reached ~1G 0 for all
the input pulses of 150 mV and 500 ms, but decayed spontaneously in the interval
between the pulses, indicating the STM mode (Fig. 7a). When T was decreased to
1 s, a long-lived transition to the higher conductance state (! G 0 for at least 20 s) was
achieved after ten inputs of the same pulse, which corresponds to the LTM mode
(Fig. 7b). When the pulse amplitude was decreased to 100 mV keeping interval at
10 s (Fig. 7c), the SM mode was observed at the 6th pulse prior to observation of the
first STM state at the 8th pulse. For the same pulse, when T was decreased to 1 s
(Fig. 7e) the first STM mode was achieved after 5 input pulses and the LTM mode
was achieved after 11 input pulses. Further, if the width was decreased to 50 ms for
the input as in Fig. 7a, the first STM state was achieved after 10 input pulses and a
LTM state was not achieved even after 30 input pulses. Figure 7f shows the
magnified view of Fig. 7c as indicated by the dashed rectangular box, in which the
conductance curves of the successive STM modes are fitted with the exponential
decay function y ¼ y 0 + A e
–t/τ , where y is the conductance, y 0 is the conductance
offset, A is the fit constant, τ is the time constant, and t is the time after each input
pulse application. Similar analysis has also been presented in the previous subsection
in the context of Ag 2 S system. Such exponential functions are most commonly used
for the quantitative description of retention in human memory [12]. Similar to the
Fig. 6 First STM formation plotted as a function of the number of input pulses for different (a)
pulse amplitudes and (b) pulse widths. Copyright 2011, AIP
182
T. Tsuruoka et al.