

Crystallization of Amorphous Pharmaceuticals at Ambient and Elevated …
79
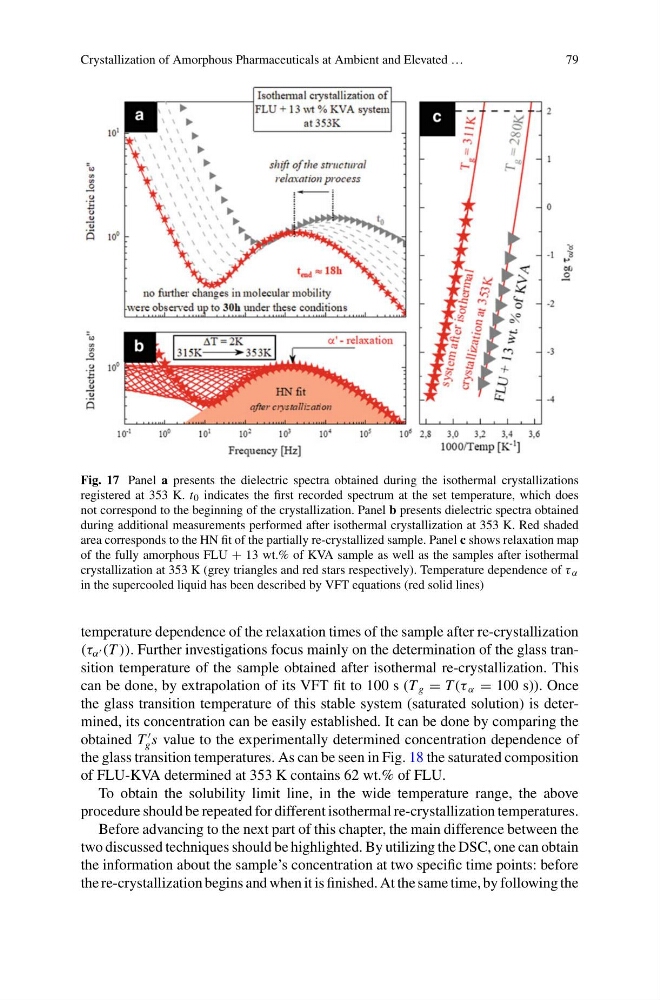
Fig. 17 Panel a presents the dielectric spectra obtained during the isothermal crystallizations
registered at 353 K. t 0 indicates the first recorded spectrum at the set temperature, which does
not correspond to the beginning of the crystallization. Panel b presents dielectric spectra obtained
during additional measurements performed after isothermal crystallization at 353 K. Red shaded
area corresponds to the HN fit of the partially re-crystallized sample. Panel c shows relaxation map
of the fully amorphous FLU + 13 wt.% of KVA sample as well as the samples after isothermal
crystallization at 353 K (grey triangles and red stars respectively). Temperature dependence of τ α
in the supercooled liquid has been described by VFT equations (red solid lines)
temperature dependence of the relaxation times of the sample after re-crystallization
(τ α (T )). Further investigations focus mainly on the determination of the glass transition temperature of the sample obtained after isothermal re-crystallization. This
can be done, by extrapolation of its VFT fit to 100 s (T g = T (τ α = 100 s)). Once
the glass transition temperature of this stable system (saturated solution) is determined, its concentration can be easily established. It can be done by comparing the
obtained T
g s value to the experimentally determined concentration dependence of
the glass transition temperatures. As can be seen in Fig. 18 the saturated composition
of FLU-KVA determined at 353 K contains 62 wt.% of FLU.
To obtain the solubility limit line, in the wide temperature range, the above
procedure should be repeated for different isothermal re-crystallization temperatures.
Before advancing to the next part of this chapter, the main difference between the
two discussed techniques should be highlighted. By utilizing the DSC, one can obtain
the information about the sample’s concentration at two specific time points: before
the re-crystallization begins and when it is finished. At the same time, by following the
79
Fig. 17 Panel a presents the dielectric spectra obtained during the isothermal crystallizations
registered at 353 K. t 0 indicates the first recorded spectrum at the set temperature, which does
not correspond to the beginning of the crystallization. Panel b presents dielectric spectra obtained
during additional measurements performed after isothermal crystallization at 353 K. Red shaded
area corresponds to the HN fit of the partially re-crystallized sample. Panel c shows relaxation map
of the fully amorphous FLU + 13 wt.% of KVA sample as well as the samples after isothermal
crystallization at 353 K (grey triangles and red stars respectively). Temperature dependence of τ α
in the supercooled liquid has been described by VFT equations (red solid lines)
temperature dependence of the relaxation times of the sample after re-crystallization
(τ α (T )). Further investigations focus mainly on the determination of the glass transition temperature of the sample obtained after isothermal re-crystallization. This
can be done, by extrapolation of its VFT fit to 100 s (T g = T (τ α = 100 s)). Once
the glass transition temperature of this stable system (saturated solution) is determined, its concentration can be easily established. It can be done by comparing the
obtained T
g s value to the experimentally determined concentration dependence of
the glass transition temperatures. As can be seen in Fig. 18 the saturated composition
of FLU-KVA determined at 353 K contains 62 wt.% of FLU.
To obtain the solubility limit line, in the wide temperature range, the above
procedure should be repeated for different isothermal re-crystallization temperatures.
Before advancing to the next part of this chapter, the main difference between the
two discussed techniques should be highlighted. By utilizing the DSC, one can obtain
the information about the sample’s concentration at two specific time points: before
the re-crystallization begins and when it is finished. At the same time, by following the