

Crystallization of Amorphous Pharmaceuticals at Ambient and Elevated …
77
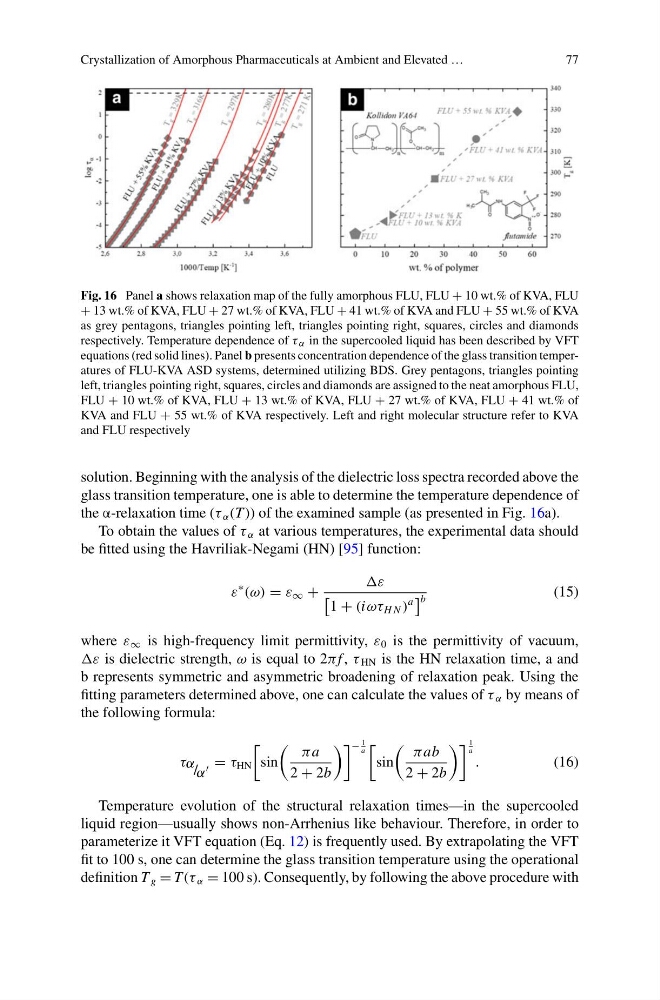
Fig. 16 Panel a shows relaxation map of the fully amorphous FLU, FLU + 10 wt.% of KVA, FLU
+ 13 wt.% of KVA, FLU + 27 wt.% of KVA, FLU + 41 wt.% of KVA and FLU + 55 wt.% of KVA
as grey pentagons, triangles pointing left, triangles pointing right, squares, circles and diamonds
respectively. Temperature dependence of τ α in the supercooled liquid has been described by VFT
equations (red solid lines). Panel b presents concentration dependence of the glass transition temperatures of FLU-KVA ASD systems, determined utilizing BDS. Grey pentagons, triangles pointing
left, triangles pointing right, squares, circles and diamonds are assigned to the neat amorphous FLU,
FLU + 10 wt.% of KVA, FLU + 13 wt.% of KVA, FLU + 27 wt.% of KVA, FLU + 41 wt.% of
KVA and FLU + 55 wt.% of KVA respectively. Left and right molecular structure refer to KVA
and FLU respectively
solution. Beginning with the analysis of the dielectric loss spectra recorded above the
glass transition temperature, one is able to determine the temperature dependence of
the α-relaxation time (τ α (T )) of the examined sample (as presented in Fig. 16a).
To obtain the values of τ α at various temperatures, the experimental data should
be fitted using the Havriliak-Negami (HN) [95] function:
ε
∗
(ω) = ε ∞ +
ε
1 + (iωτ H N )
a
b
(15)
where ε ∞ is high-frequency limit permittivity, ε 0 is the permittivity of vacuum,
ε is dielectric strength, ω is equal to 2π f , τ HN is the HN relaxation time, a and
b represents symmetric and asymmetric broadening of relaxation peak. Using the
fitting parameters determined above, one can calculate the values of τ α by means of
the following formula:
τα
/ α
= τ HN
sin
πa
2 + 2b
−
1
a
sin
πab
2 + 2b
1
a .
(16)
Temperature evolution of the structural relaxation times—in the supercooled
liquid region—usually shows non-Arrhenius like behaviour. Therefore, in order to
parameterize it VFT equation (Eq. 12) is frequently used. By extrapolating the VFT
fit to 100 s, one can determine the glass transition temperature using the operational
definition T g = T (τ α = 100 s). Consequently, by following the above procedure with
77
Fig. 16 Panel a shows relaxation map of the fully amorphous FLU, FLU + 10 wt.% of KVA, FLU
+ 13 wt.% of KVA, FLU + 27 wt.% of KVA, FLU + 41 wt.% of KVA and FLU + 55 wt.% of KVA
as grey pentagons, triangles pointing left, triangles pointing right, squares, circles and diamonds
respectively. Temperature dependence of τ α in the supercooled liquid has been described by VFT
equations (red solid lines). Panel b presents concentration dependence of the glass transition temperatures of FLU-KVA ASD systems, determined utilizing BDS. Grey pentagons, triangles pointing
left, triangles pointing right, squares, circles and diamonds are assigned to the neat amorphous FLU,
FLU + 10 wt.% of KVA, FLU + 13 wt.% of KVA, FLU + 27 wt.% of KVA, FLU + 41 wt.% of
KVA and FLU + 55 wt.% of KVA respectively. Left and right molecular structure refer to KVA
and FLU respectively
solution. Beginning with the analysis of the dielectric loss spectra recorded above the
glass transition temperature, one is able to determine the temperature dependence of
the α-relaxation time (τ α (T )) of the examined sample (as presented in Fig. 16a).
To obtain the values of τ α at various temperatures, the experimental data should
be fitted using the Havriliak-Negami (HN) [95] function:
ε
∗
(ω) = ε ∞ +
ε
1 + (iωτ H N )
a
b
(15)
where ε ∞ is high-frequency limit permittivity, ε 0 is the permittivity of vacuum,
ε is dielectric strength, ω is equal to 2π f , τ HN is the HN relaxation time, a and
b represents symmetric and asymmetric broadening of relaxation peak. Using the
fitting parameters determined above, one can calculate the values of τ α by means of
the following formula:
τα
/ α
= τ HN
sin
πa
2 + 2b
−
1
a
sin
πab
2 + 2b
1
a .
(16)
Temperature evolution of the structural relaxation times—in the supercooled
liquid region—usually shows non-Arrhenius like behaviour. Therefore, in order to
parameterize it VFT equation (Eq. 12) is frequently used. By extrapolating the VFT
fit to 100 s, one can determine the glass transition temperature using the operational
definition T g = T (τ α = 100 s). Consequently, by following the above procedure with