

68
J. Knapik-Kowalczuk et al.
Both τ cr and n Avramov parameters of all investigated temperatures are collected
together with the Avrami parameters in Table 2.
It should be noted that the ε
N (τ cr ) = 1 − 1/e, what approximately gives the value
of 3.63. If the ε
N at τ cr will be lower than this value, it means that the induction
time is different than 0. Since in the example presented in Fig. 7 the value of ε
N (τ cr )
is equal to 0.65, one can conclude that the tε
N , in this particular case, is equal to
0. However, at lower temperatures the induction time of crystallization of NIM is
greater than zero since ε
N (τ cr ) < 0.63.
The parameters obtained from either Avrami or Avramov model can be further
used to determine the activation energy for crystallization (E a ) by employing the
Arrhenius law:
log k = log k 0 −
E a
RT
log e
(10)
The crystallization rate k presented in the above equation is related to (i) the
Avrami parameters as follow: k = K
1/n or (ii) the Avramov parameter τ cr as k =
1/τ cr . R in above formula is the gas constant, while k 0 and E a are fitting parameters.
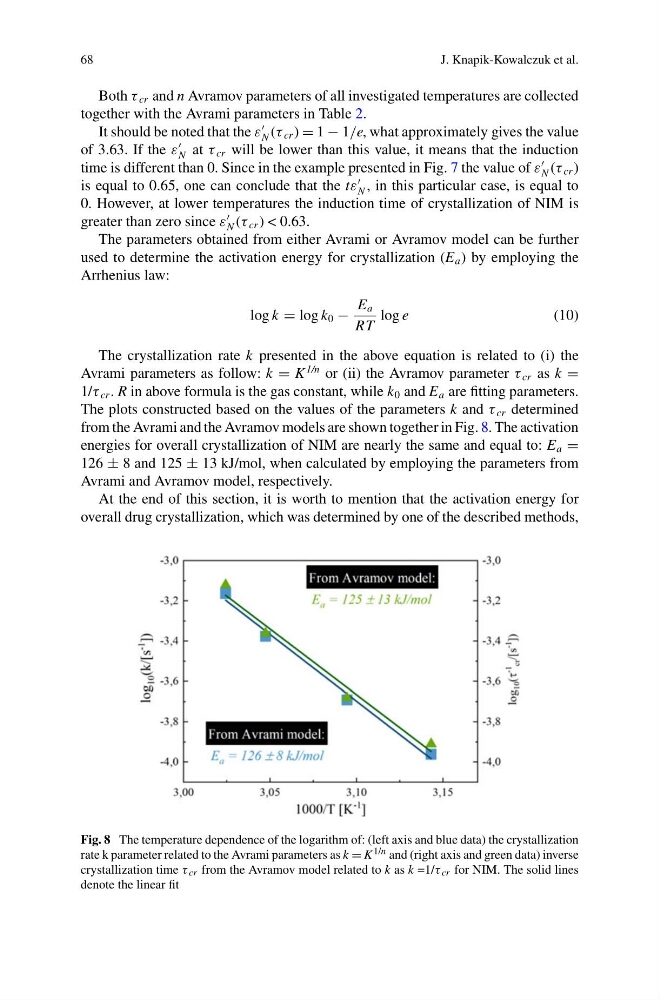
The plots constructed based on the values of the parameters k and τ cr determined
from the Avrami and the Avramov models are shown together in Fig. 8. The activation
energies for overall crystallization of NIM are nearly the same and equal to: E a =
126 ± 8 and 125 ± 13 kJ/mol, when calculated by employing the parameters from
Avrami and Avramov model, respectively.
At the end of this section, it is worth to mention that the activation energy for
overall drug crystallization, which was determined by one of the described methods,
Fig. 8 The temperature dependence of the logarithm of: (left axis and blue data) the crystallization
rate k parameter related to the Avrami parameters as k = K 1/n and (right axis and green data) inverse
crystallization time τ cr from the Avramov model related to k as k =1/τ cr for NIM. The solid lines
denote the linear fit
J. Knapik-Kowalczuk et al.
Both τ cr and n Avramov parameters of all investigated temperatures are collected
together with the Avrami parameters in Table 2.
It should be noted that the ε
N (τ cr ) = 1 − 1/e, what approximately gives the value
of 3.63. If the ε
N at τ cr will be lower than this value, it means that the induction
time is different than 0. Since in the example presented in Fig. 7 the value of ε
N (τ cr )
is equal to 0.65, one can conclude that the tε
N , in this particular case, is equal to
0. However, at lower temperatures the induction time of crystallization of NIM is
greater than zero since ε
N (τ cr ) < 0.63.
The parameters obtained from either Avrami or Avramov model can be further
used to determine the activation energy for crystallization (E a ) by employing the
Arrhenius law:
log k = log k 0 −
E a
RT
log e
(10)
The crystallization rate k presented in the above equation is related to (i) the
Avrami parameters as follow: k = K
1/n or (ii) the Avramov parameter τ cr as k =
1/τ cr . R in above formula is the gas constant, while k 0 and E a are fitting parameters.
The plots constructed based on the values of the parameters k and τ cr determined
from the Avrami and the Avramov models are shown together in Fig. 8. The activation
energies for overall crystallization of NIM are nearly the same and equal to: E a =
126 ± 8 and 125 ± 13 kJ/mol, when calculated by employing the parameters from
Avrami and Avramov model, respectively.
At the end of this section, it is worth to mention that the activation energy for
overall drug crystallization, which was determined by one of the described methods,
Fig. 8 The temperature dependence of the logarithm of: (left axis and blue data) the crystallization
rate k parameter related to the Avrami parameters as k = K 1/n and (right axis and green data) inverse
crystallization time τ cr from the Avramov model related to k as k =1/τ cr for NIM. The solid lines
denote the linear fit