

36
K. Adrjanowicz
Since a number of natural phenomena and industrial processes require fast
processing or take place under non-isothermal or non-isobaric conditions, understanding the accompanying phase transformation phenomena is critical to obtain
materials with desired physicochemical features. Therefore, the idea of this study
was to qualitatively compare the effect of temperature and pressure on the crystallization tendency of glass-forming liquid. Studied sample is propylene carbonate
(PC) often termed in the literature as a canonical glass-former with T g = 159 K and
T m = 218 K. Both values refer to atmospheric pressure conditions [61, 69]. The
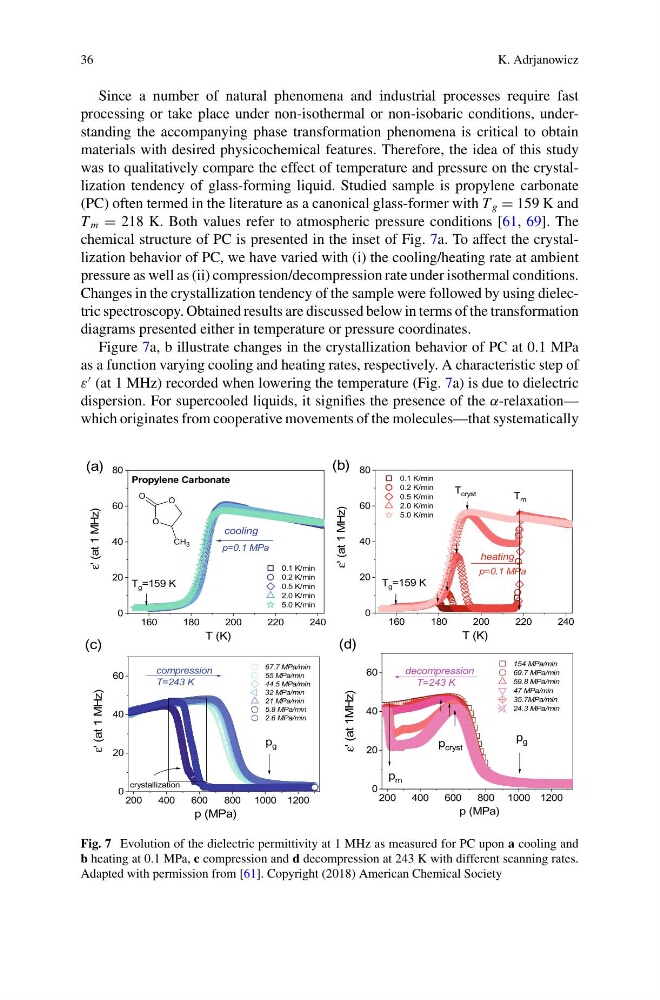
chemical structure of PC is presented in the inset of Fig. 7a. To affect the crystallization behavior of PC, we have varied with (i) the cooling/heating rate at ambient
pressure as well as (ii) compression/decompression rate under isothermal conditions.
Changes in the crystallization tendency of the sample were followed by using dielectric spectroscopy. Obtained results are discussed below in terms of the transformation
diagrams presented either in temperature or pressure coordinates.
Figure 7a, b illustrate changes in the crystallization behavior of PC at 0.1 MPa
as a function varying cooling and heating rates, respectively. A characteristic step of
ε
(at 1 MHz) recorded when lowering the temperature (Fig. 7a) is due to dielectric
dispersion. For supercooled liquids, it signifies the presence of the α-relaxation—
which originates from cooperative movements of the molecules—that systematically
160
180
200
220
240
0
20
40
60
80
160
180
200
220
240
0
20
40
60
80
200
400
600
800 1000 1200
0
20
40
60
200
400
600
800 1000 1200
0
20
40
60
p=0.1 MPa
ε' (at 1 MHz)
0.1 K/min
0.2 K/min
0.5 K/min
2.0 K/min
5.0 K/min
T (K)
cooling
Propylene Carbonate
CH 3
O
O
O
T g =159 K
T g =159 K
T cryst
p=0.1 MPa
0.1 K/min
0.2 K/min
0.5 K/min
2.0 K/min
5.0 K/min
ε' (at 1 MHz)
T (K)
heating
T m
p g
67.7 MPa/min
55 MPa/min
44.5 MPa/min
32 MPa/min
21 MPa/min
5.8 MPa/min
2.6 MPa/min
ε' (at 1 MHz)
p (MPa)
compression
T=243 K
crystallization
(b)
154 MPa/min
69.7 MPa/min
59.8 MPa/min
47 MPa/min
35.7MPa/min
24.3 MPa/min
ε' (at 1MHz)
p (MPa)
decompression
T=243 K
p m
p cryst
(a)
(c)
(d)
p g
Fig. 7 Evolution of the dielectric permittivity at 1 MHz as measured for PC upon a cooling and
b heating at 0.1 MPa, c compression and d decompression at 243 K with different scanning rates.
Adapted with permission from [61]. Copyright (2018) American Chemical Society
K. Adrjanowicz
Since a number of natural phenomena and industrial processes require fast
processing or take place under non-isothermal or non-isobaric conditions, understanding the accompanying phase transformation phenomena is critical to obtain
materials with desired physicochemical features. Therefore, the idea of this study
was to qualitatively compare the effect of temperature and pressure on the crystallization tendency of glass-forming liquid. Studied sample is propylene carbonate
(PC) often termed in the literature as a canonical glass-former with T g = 159 K and
T m = 218 K. Both values refer to atmospheric pressure conditions [61, 69]. The
chemical structure of PC is presented in the inset of Fig. 7a. To affect the crystallization behavior of PC, we have varied with (i) the cooling/heating rate at ambient
pressure as well as (ii) compression/decompression rate under isothermal conditions.
Changes in the crystallization tendency of the sample were followed by using dielectric spectroscopy. Obtained results are discussed below in terms of the transformation
diagrams presented either in temperature or pressure coordinates.
Figure 7a, b illustrate changes in the crystallization behavior of PC at 0.1 MPa
as a function varying cooling and heating rates, respectively. A characteristic step of
ε
(at 1 MHz) recorded when lowering the temperature (Fig. 7a) is due to dielectric
dispersion. For supercooled liquids, it signifies the presence of the α-relaxation—
which originates from cooperative movements of the molecules—that systematically
160
180
200
220
240
0
20
40
60
80
160
180
200
220
240
0
20
40
60
80
200
400
600
800 1000 1200
0
20
40
60
200
400
600
800 1000 1200
0
20
40
60
p=0.1 MPa
ε' (at 1 MHz)
0.1 K/min
0.2 K/min
0.5 K/min
2.0 K/min
5.0 K/min
T (K)
cooling
Propylene Carbonate
CH 3
O
O
O
T g =159 K
T g =159 K
T cryst
p=0.1 MPa
0.1 K/min
0.2 K/min
0.5 K/min
2.0 K/min
5.0 K/min
ε' (at 1 MHz)
T (K)
heating
T m
p g
67.7 MPa/min
55 MPa/min
44.5 MPa/min
32 MPa/min
21 MPa/min
5.8 MPa/min
2.6 MPa/min
ε' (at 1 MHz)
p (MPa)
compression
T=243 K
crystallization
(b)
154 MPa/min
69.7 MPa/min
59.8 MPa/min
47 MPa/min
35.7MPa/min
24.3 MPa/min
ε' (at 1MHz)
p (MPa)
decompression
T=243 K
p m
p cryst
(a)
(c)
(d)
p g
Fig. 7 Evolution of the dielectric permittivity at 1 MHz as measured for PC upon a cooling and
b heating at 0.1 MPa, c compression and d decompression at 243 K with different scanning rates.
Adapted with permission from [61]. Copyright (2018) American Chemical Society