

High-Pressure Crystallization of Glass-Forming Liquids …
35
10
0
10
1
10
2
10
3
10
4
10
5
10
6
-80
-60
-40
-20
0
TTT diagram
T-T
m (K)
time (s)
GLASS
CRYSTAL
in c re a s in g c o o li n g ra te
SUPERCOOLED
LIQUID
LIQUID
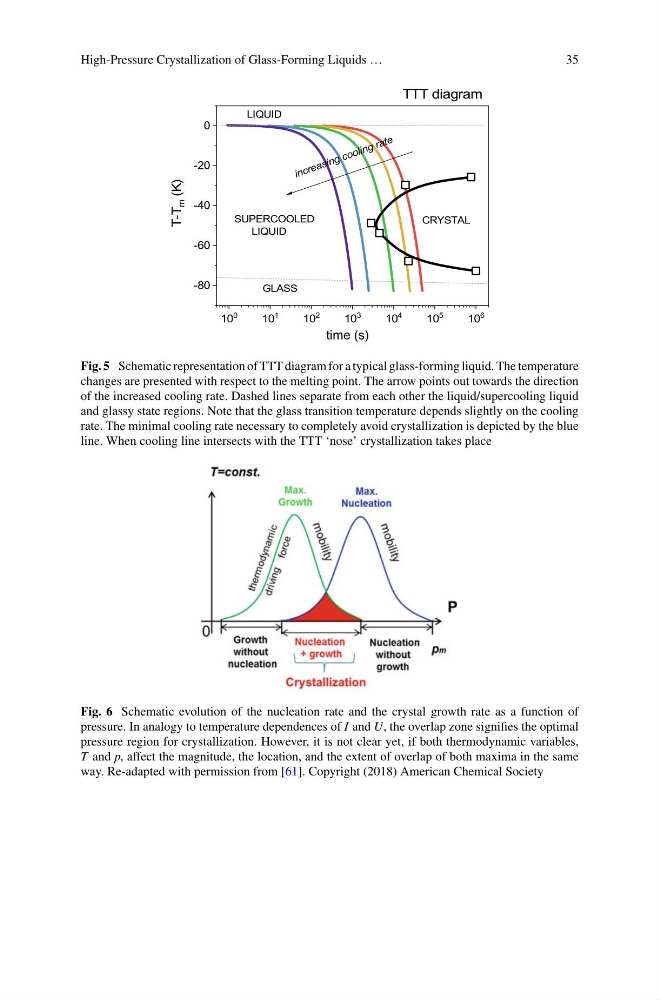
Fig. 5 Schematic representation of TTT diagram for a typical glass-forming liquid. The temperature
changes are presented with respect to the melting point. The arrow points out towards the direction
of the increased cooling rate. Dashed lines separate from each other the liquid/supercooling liquid
and glassy state regions. Note that the glass transition temperature depends slightly on the cooling
rate. The minimal cooling rate necessary to completely avoid crystallization is depicted by the blue
line. When cooling line intersects with the TTT ‘nose’ crystallization takes place
Fig. 6 Schematic evolution of the nucleation rate and the crystal growth rate as a function of
pressure. In analogy to temperature dependences of I and U, the overlap zone signifies the optimal
pressure region for crystallization. However, it is not clear yet, if both thermodynamic variables,
T and p, affect the magnitude, the location, and the extent of overlap of both maxima in the same
way. Re-adapted with permission from [61]. Copyright (2018) American Chemical Society
35
10
0
10
1
10
2
10
3
10
4
10
5
10
6
-80
-60
-40
-20
0
TTT diagram
T-T
m (K)
time (s)
GLASS
CRYSTAL
in c re a s in g c o o li n g ra te
SUPERCOOLED
LIQUID
LIQUID
Fig. 5 Schematic representation of TTT diagram for a typical glass-forming liquid. The temperature
changes are presented with respect to the melting point. The arrow points out towards the direction
of the increased cooling rate. Dashed lines separate from each other the liquid/supercooling liquid
and glassy state regions. Note that the glass transition temperature depends slightly on the cooling
rate. The minimal cooling rate necessary to completely avoid crystallization is depicted by the blue
line. When cooling line intersects with the TTT ‘nose’ crystallization takes place
Fig. 6 Schematic evolution of the nucleation rate and the crystal growth rate as a function of
pressure. In analogy to temperature dependences of I and U, the overlap zone signifies the optimal
pressure region for crystallization. However, it is not clear yet, if both thermodynamic variables,
T and p, affect the magnitude, the location, and the extent of overlap of both maxima in the same
way. Re-adapted with permission from [61]. Copyright (2018) American Chemical Society