

Confined Glassy Dynamics in a Star-Shaped Polymer …
283
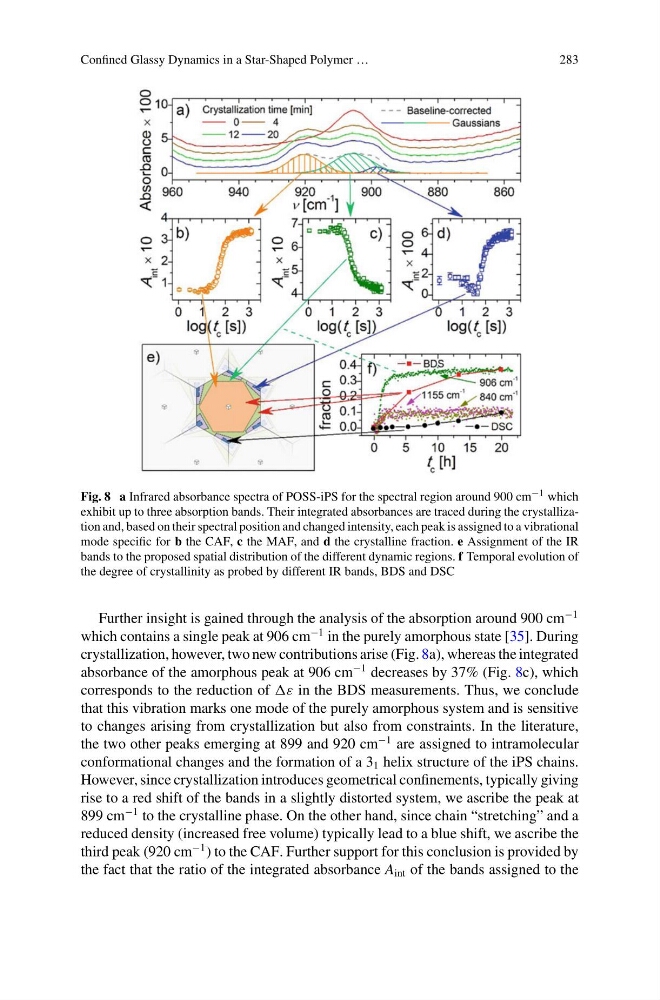
Fig. 8 a Infrared absorbance spectra of POSS-iPS for the spectral region around 900 cm −1 which
exhibit up to three absorption bands. Their integrated absorbances are traced during the crystallization and, based on their spectral position and changed intensity, each peak is assigned to a vibrational
mode specific for b the CAF, c the MAF, and d the crystalline fraction. e Assignment of the IR
bands to the proposed spatial distribution of the different dynamic regions. f Temporal evolution of
the degree of crystallinity as probed by different IR bands, BDS and DSC
Further insight is gained through the analysis of the absorption around 900 cm
−1
which contains a single peak at 906 cm
−1 in the purely amorphous state [35]. During
crystallization, however, two new contributions arise (Fig. 8a), whereas the integrated
absorbance of the amorphous peak at 906 cm
−1 decreases by 37% (Fig. 8c), which
corresponds to the reduction of ε in the BDS measurements. Thus, we conclude
that this vibration marks one mode of the purely amorphous system and is sensitive
to changes arising from crystallization but also from constraints. In the literature,
the two other peaks emerging at 899 and 920 cm
−1 are assigned to intramolecular
conformational changes and the formation of a 3 1 helix structure of the iPS chains.
However, since crystallization introduces geometrical confinements, typically giving
rise to a red shift of the bands in a slightly distorted system, we ascribe the peak at
899 cm
−1 to the crystalline phase. On the other hand, since chain “stretching” and a
reduced density (increased free volume) typically lead to a blue shift, we ascribe the
third peak (920 cm
−1 ) to the CAF. Further support for this conclusion is provided by
the fact that the ratio of the integrated absorbance A int of the bands assigned to the
283
Fig. 8 a Infrared absorbance spectra of POSS-iPS for the spectral region around 900 cm −1 which
exhibit up to three absorption bands. Their integrated absorbances are traced during the crystallization and, based on their spectral position and changed intensity, each peak is assigned to a vibrational
mode specific for b the CAF, c the MAF, and d the crystalline fraction. e Assignment of the IR
bands to the proposed spatial distribution of the different dynamic regions. f Temporal evolution of
the degree of crystallinity as probed by different IR bands, BDS and DSC
Further insight is gained through the analysis of the absorption around 900 cm
−1
which contains a single peak at 906 cm
−1 in the purely amorphous state [35]. During
crystallization, however, two new contributions arise (Fig. 8a), whereas the integrated
absorbance of the amorphous peak at 906 cm
−1 decreases by 37% (Fig. 8c), which
corresponds to the reduction of ε in the BDS measurements. Thus, we conclude
that this vibration marks one mode of the purely amorphous system and is sensitive
to changes arising from crystallization but also from constraints. In the literature,
the two other peaks emerging at 899 and 920 cm
−1 are assigned to intramolecular
conformational changes and the formation of a 3 1 helix structure of the iPS chains.
However, since crystallization introduces geometrical confinements, typically giving
rise to a red shift of the bands in a slightly distorted system, we ascribe the peak at
899 cm
−1 to the crystalline phase. On the other hand, since chain “stretching” and a
reduced density (increased free volume) typically lead to a blue shift, we ascribe the
third peak (920 cm
−1 ) to the CAF. Further support for this conclusion is provided by
the fact that the ratio of the integrated absorbance A int of the bands assigned to the