

282
M. Tress et al.
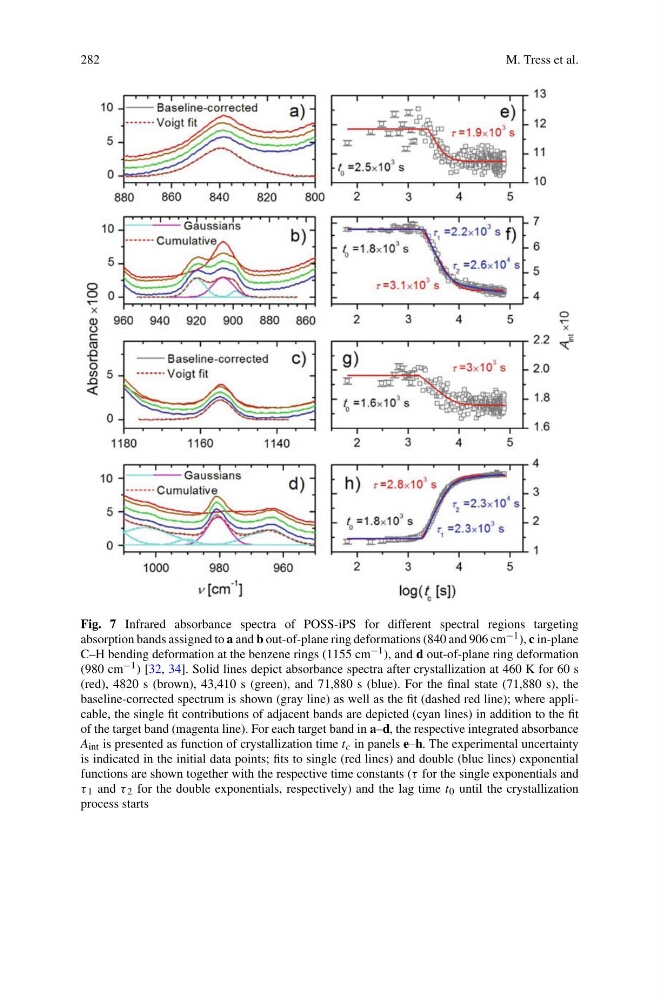
Fig. 7 Infrared absorbance spectra of POSS-iPS for different spectral regions targeting
absorption bands assigned to a and b out-of-plane ring deformations (840 and 906 cm −1 ), c in-plane
C–H bending deformation at the benzene rings (1155 cm −1 ), and d out-of-plane ring deformation
(980 cm −1 ) [32, 34]. Solid lines depict absorbance spectra after crystallization at 460 K for 60 s
(red), 4820 s (brown), 43,410 s (green), and 71,880 s (blue). For the final state (71,880 s), the
baseline-corrected spectrum is shown (gray line) as well as the fit (dashed red line); where applicable, the single fit contributions of adjacent bands are depicted (cyan lines) in addition to the fit
of the target band (magenta line). For each target band in a–d, the respective integrated absorbance
A int is presented as function of crystallization time t c in panels e–h. The experimental uncertainty
is indicated in the initial data points; fits to single (red lines) and double (blue lines) exponential
functions are shown together with the respective time constants (τ for the single exponentials and
τ 1 and τ 2 for the double exponentials, respectively) and the lag time t 0 until the crystallization
process starts
M. Tress et al.
Fig. 7 Infrared absorbance spectra of POSS-iPS for different spectral regions targeting
absorption bands assigned to a and b out-of-plane ring deformations (840 and 906 cm −1 ), c in-plane
C–H bending deformation at the benzene rings (1155 cm −1 ), and d out-of-plane ring deformation
(980 cm −1 ) [32, 34]. Solid lines depict absorbance spectra after crystallization at 460 K for 60 s
(red), 4820 s (brown), 43,410 s (green), and 71,880 s (blue). For the final state (71,880 s), the
baseline-corrected spectrum is shown (gray line) as well as the fit (dashed red line); where applicable, the single fit contributions of adjacent bands are depicted (cyan lines) in addition to the fit
of the target band (magenta line). For each target band in a–d, the respective integrated absorbance
A int is presented as function of crystallization time t c in panels e–h. The experimental uncertainty
is indicated in the initial data points; fits to single (red lines) and double (blue lines) exponential
functions are shown together with the respective time constants (τ for the single exponentials and
τ 1 and τ 2 for the double exponentials, respectively) and the lag time t 0 until the crystallization
process starts