

280
M. Tress et al.
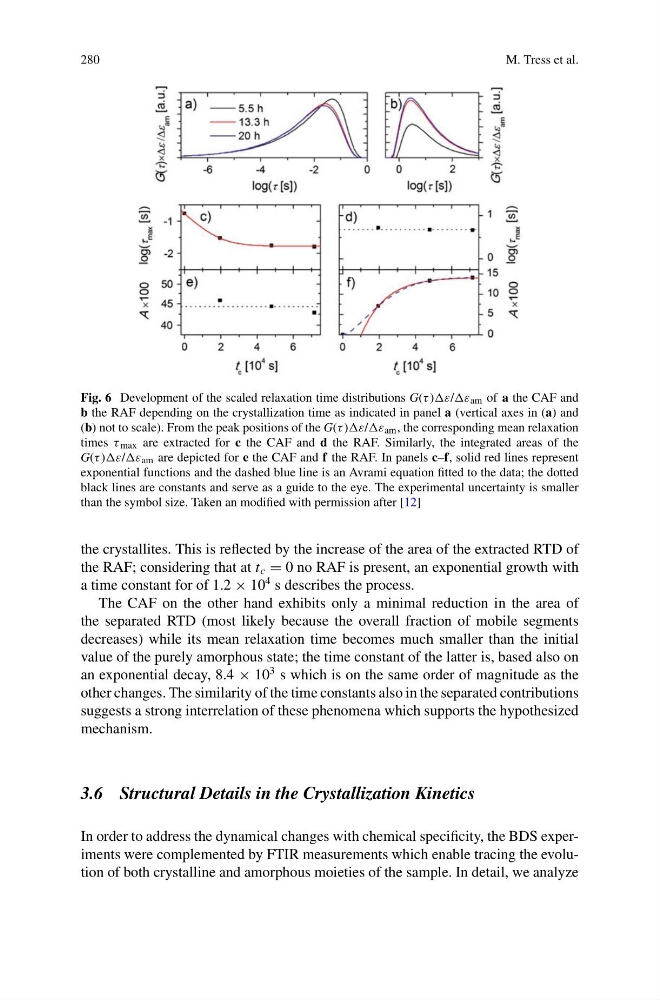
Fig. 6 Development of the scaled relaxation time distributions G(τ )ε/ε am of a the CAF and
b the RAF depending on the crystallization time as indicated in panel a (vertical axes in (a) and
(b) not to scale). From the peak positions of the G(τ )ε/ε am , the corresponding mean relaxation
times τ max are extracted for c the CAF and d the RAF. Similarly, the integrated areas of the
G(τ )ε/ε am are depicted for e the CAF and f the RAF. In panels c–f, solid red lines represent
exponential functions and the dashed blue line is an Avrami equation fitted to the data; the dotted
black lines are constants and serve as a guide to the eye. The experimental uncertainty is smaller
than the symbol size. Taken an modified with permission after [12]
the crystallites. This is reflected by the increase of the area of the extracted RTD of
the RAF; considering that at t c = 0 no RAF is present, an exponential growth with
a time constant for of 1.2 × 10
4 s describes the process.
The CAF on the other hand exhibits only a minimal reduction in the area of
the separated RTD (most likely because the overall fraction of mobile segments
decreases) while its mean relaxation time becomes much smaller than the initial
value of the purely amorphous state; the time constant of the latter is, based also on
an exponential decay, 8.4 × 10
3 s which is on the same order of magnitude as the
other changes. The similarity of the time constants also in the separated contributions
suggests a strong interrelation of these phenomena which supports the hypothesized
mechanism.
3.6 Structural Details in the Crystallization Kinetics
In order to address the dynamical changes with chemical specificity, the BDS experiments were complemented by FTIR measurements which enable tracing the evolution of both crystalline and amorphous moieties of the sample. In detail, we analyze
M. Tress et al.
Fig. 6 Development of the scaled relaxation time distributions G(τ )ε/ε am of a the CAF and
b the RAF depending on the crystallization time as indicated in panel a (vertical axes in (a) and
(b) not to scale). From the peak positions of the G(τ )ε/ε am , the corresponding mean relaxation
times τ max are extracted for c the CAF and d the RAF. Similarly, the integrated areas of the
G(τ )ε/ε am are depicted for e the CAF and f the RAF. In panels c–f, solid red lines represent
exponential functions and the dashed blue line is an Avrami equation fitted to the data; the dotted
black lines are constants and serve as a guide to the eye. The experimental uncertainty is smaller
than the symbol size. Taken an modified with permission after [12]
the crystallites. This is reflected by the increase of the area of the extracted RTD of
the RAF; considering that at t c = 0 no RAF is present, an exponential growth with
a time constant for of 1.2 × 10
4 s describes the process.
The CAF on the other hand exhibits only a minimal reduction in the area of
the separated RTD (most likely because the overall fraction of mobile segments
decreases) while its mean relaxation time becomes much smaller than the initial
value of the purely amorphous state; the time constant of the latter is, based also on
an exponential decay, 8.4 × 10
3 s which is on the same order of magnitude as the
other changes. The similarity of the time constants also in the separated contributions
suggests a strong interrelation of these phenomena which supports the hypothesized
mechanism.
3.6 Structural Details in the Crystallization Kinetics
In order to address the dynamical changes with chemical specificity, the BDS experiments were complemented by FTIR measurements which enable tracing the evolution of both crystalline and amorphous moieties of the sample. In detail, we analyze