

Confined Glassy Dynamics in a Star-Shaped Polymer …
279
3.5 Kinetics of the Crystallization and Coevolution
of the Dynamical Changes
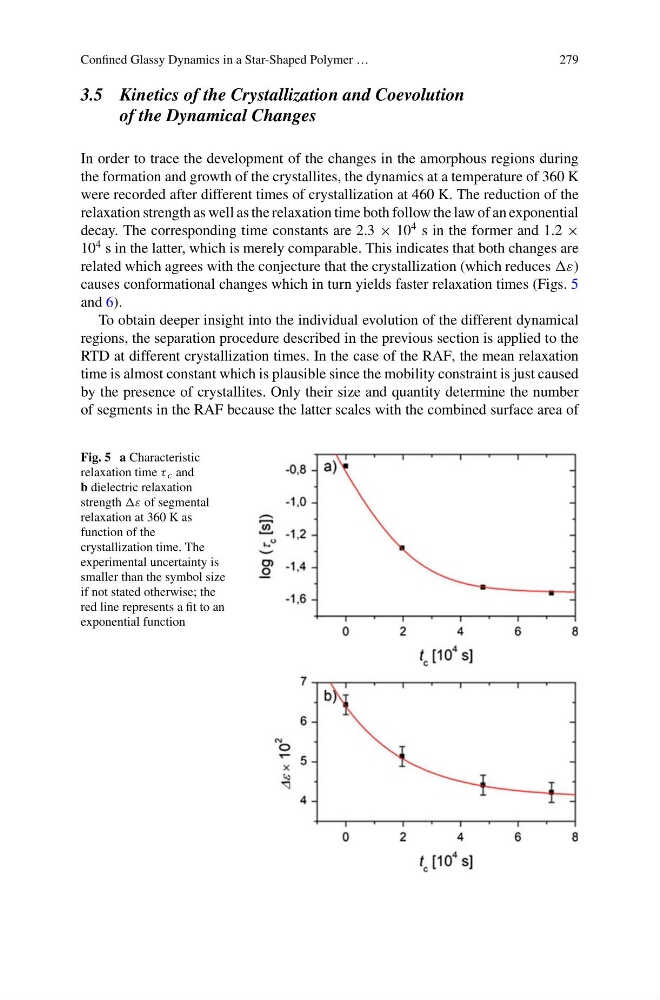
In order to trace the development of the changes in the amorphous regions during
the formation and growth of the crystallites, the dynamics at a temperature of 360 K
were recorded after different times of crystallization at 460 K. The reduction of the
relaxation strength as well as the relaxation time both follow the law of an exponential
decay. The corresponding time constants are 2.3 × 10
4 s in the former and 1.2 ×
10
4 s in the latter, which is merely comparable. This indicates that both changes are
related which agrees with the conjecture that the crystallization (which reduces ε)
causes conformational changes which in turn yields faster relaxation times (Figs. 5
and 6).
To obtain deeper insight into the individual evolution of the different dynamical
regions, the separation procedure described in the previous section is applied to the
RTD at different crystallization times. In the case of the RAF, the mean relaxation
time is almost constant which is plausible since the mobility constraint is just caused
by the presence of crystallites. Only their size and quantity determine the number
of segments in the RAF because the latter scales with the combined surface area of
Fig. 5 a Characteristic
relaxation time τ c and
b dielectric relaxation
strength ε of segmental
relaxation at 360 K as
function of the
crystallization time. The
experimental uncertainty is
smaller than the symbol size
if not stated otherwise; the
red line represents a fit to an
exponential function
279
3.5 Kinetics of the Crystallization and Coevolution
of the Dynamical Changes
In order to trace the development of the changes in the amorphous regions during
the formation and growth of the crystallites, the dynamics at a temperature of 360 K
were recorded after different times of crystallization at 460 K. The reduction of the
relaxation strength as well as the relaxation time both follow the law of an exponential
decay. The corresponding time constants are 2.3 × 10
4 s in the former and 1.2 ×
10
4 s in the latter, which is merely comparable. This indicates that both changes are
related which agrees with the conjecture that the crystallization (which reduces ε)
causes conformational changes which in turn yields faster relaxation times (Figs. 5
and 6).
To obtain deeper insight into the individual evolution of the different dynamical
regions, the separation procedure described in the previous section is applied to the
RTD at different crystallization times. In the case of the RAF, the mean relaxation
time is almost constant which is plausible since the mobility constraint is just caused
by the presence of crystallites. Only their size and quantity determine the number
of segments in the RAF because the latter scales with the combined surface area of
Fig. 5 a Characteristic
relaxation time τ c and
b dielectric relaxation
strength ε of segmental
relaxation at 360 K as
function of the
crystallization time. The
experimental uncertainty is
smaller than the symbol size
if not stated otherwise; the
red line represents a fit to an
exponential function