

Dielectric Behavior of Nonpolar Polymers and Their Composites …
253
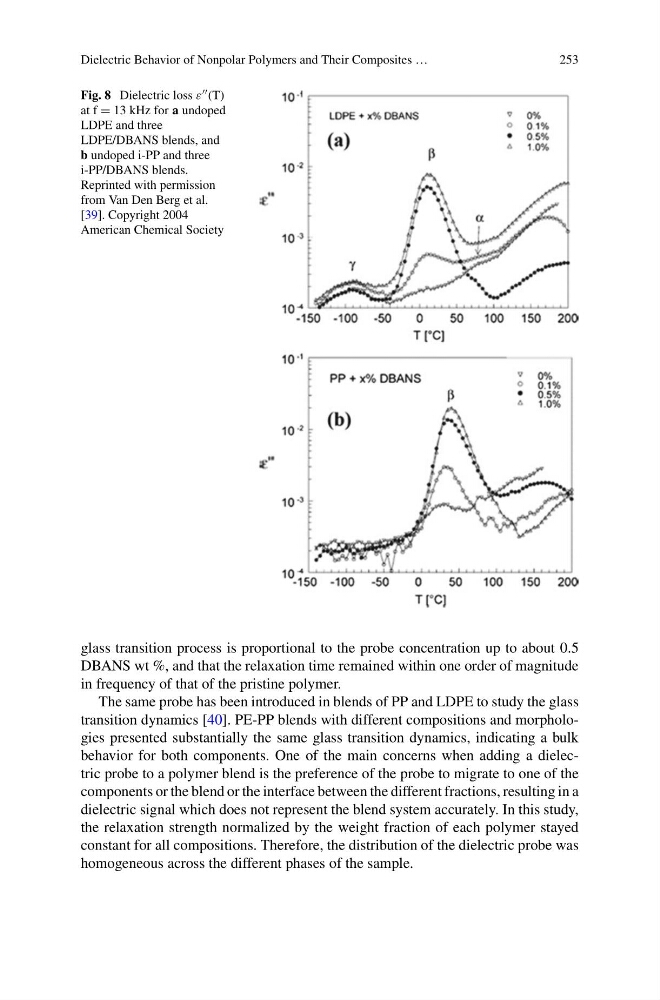
Fig. 8 Dielectric loss ε (T)
at f = 13 kHz for a undoped
LDPE and three
LDPE/DBANS blends, and
b undoped i-PP and three
i-PP/DBANS blends.
Reprinted with permission
from Van Den Berg et al.
[39]. Copyright 2004
American Chemical Society
glass transition process is proportional to the probe concentration up to about 0.5
DBANS wt %, and that the relaxation time remained within one order of magnitude
in frequency of that of the pristine polymer.
The same probe has been introduced in blends of PP and LDPE to study the glass
transition dynamics [40]. PE-PP blends with different compositions and morphologies presented substantially the same glass transition dynamics, indicating a bulk
behavior for both components. One of the main concerns when adding a dielectric probe to a polymer blend is the preference of the probe to migrate to one of the
components or the blend or the interface between the different fractions, resulting in a
dielectric signal which does not represent the blend system accurately. In this study,
the relaxation strength normalized by the weight fraction of each polymer stayed
constant for all compositions. Therefore, the distribution of the dielectric probe was
homogeneous across the different phases of the sample.
253
Fig. 8 Dielectric loss ε (T)
at f = 13 kHz for a undoped
LDPE and three
LDPE/DBANS blends, and
b undoped i-PP and three
i-PP/DBANS blends.
Reprinted with permission
from Van Den Berg et al.
[39]. Copyright 2004
American Chemical Society
glass transition process is proportional to the probe concentration up to about 0.5
DBANS wt %, and that the relaxation time remained within one order of magnitude
in frequency of that of the pristine polymer.
The same probe has been introduced in blends of PP and LDPE to study the glass
transition dynamics [40]. PE-PP blends with different compositions and morphologies presented substantially the same glass transition dynamics, indicating a bulk
behavior for both components. One of the main concerns when adding a dielectric probe to a polymer blend is the preference of the probe to migrate to one of the
components or the blend or the interface between the different fractions, resulting in a
dielectric signal which does not represent the blend system accurately. In this study,
the relaxation strength normalized by the weight fraction of each polymer stayed
constant for all compositions. Therefore, the distribution of the dielectric probe was
homogeneous across the different phases of the sample.