

232
S. Napolitano
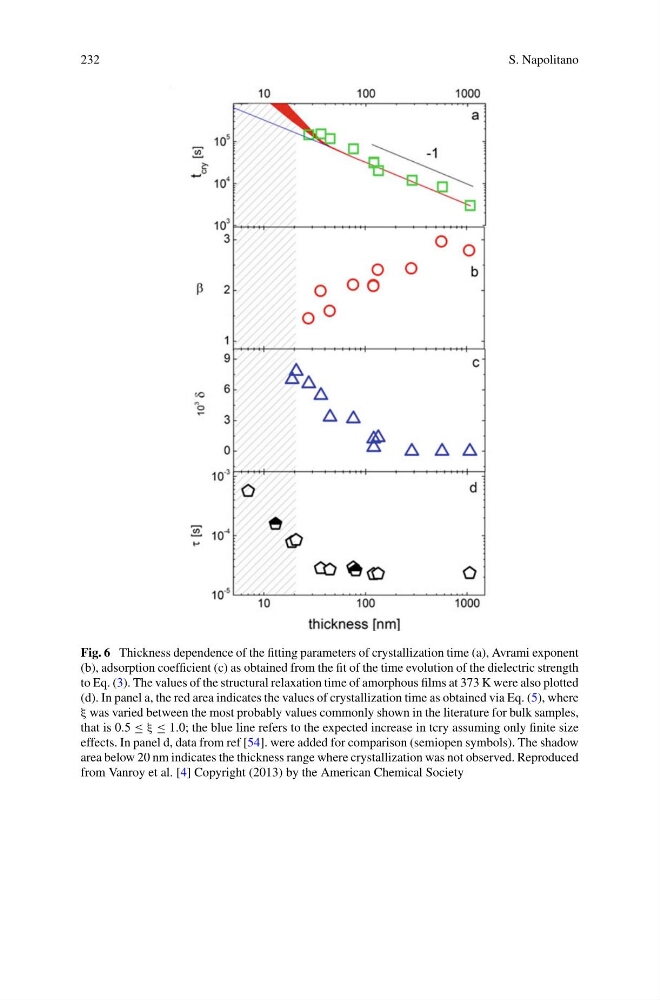
Fig. 6 Thickness dependence of the fitting parameters of crystallization time (a), Avrami exponent
(b), adsorption coefficient (c) as obtained from the fit of the time evolution of the dielectric strength
to Eq. (3). The values of the structural relaxation time of amorphous films at 373 K were also plotted
(d). In panel a, the red area indicates the values of crystallization time as obtained via Eq. (5), where
ξ was varied between the most probably values commonly shown in the literature for bulk samples,
that is 0.5 ≤ ξ ≤ 1.0; the blue line refers to the expected increase in tcry assuming only finite size
effects. In panel d, data from ref [54]. were added for comparison (semiopen symbols). The shadow
area below 20 nm indicates the thickness range where crystallization was not observed. Reproduced
from Vanroy et al. [4] Copyright (2013) by the American Chemical Society
S. Napolitano
Fig. 6 Thickness dependence of the fitting parameters of crystallization time (a), Avrami exponent
(b), adsorption coefficient (c) as obtained from the fit of the time evolution of the dielectric strength
to Eq. (3). The values of the structural relaxation time of amorphous films at 373 K were also plotted
(d). In panel a, the red area indicates the values of crystallization time as obtained via Eq. (5), where
ξ was varied between the most probably values commonly shown in the literature for bulk samples,
that is 0.5 ≤ ξ ≤ 1.0; the blue line refers to the expected increase in tcry assuming only finite size
effects. In panel d, data from ref [54]. were added for comparison (semiopen symbols). The shadow
area below 20 nm indicates the thickness range where crystallization was not observed. Reproduced
from Vanroy et al. [4] Copyright (2013) by the American Chemical Society