

226
S. Napolitano
3.1 Is the Increase in Crystallization Time upon Confinement
Straightforwardly Related to Slower Segmental
Dynamics?
Measurements by Napolitano et al. in 2006 [36] could provide an answer to the question. By assembling nanocapacitors of poly(3-hydroxy butyrate), PHB, the authors
showed that a reduction in crystallization rate does not imply an increase in relaxation
time.
Bulk amorphous samples were produced by melting the polymer powder (M w =
170 k, by Sigma) for 3 min at 175 °C (T m
DSC
= 433 K) and then cooling the melt
onto a cold surface (metallic plate previously cooled at 268 K). Bulk samples were
prepared between two brass circular electrodes, separated by glassy fibers (diameter
= 50 μm), which fixed the sample thickness and allowed avoiding shortcuts. A
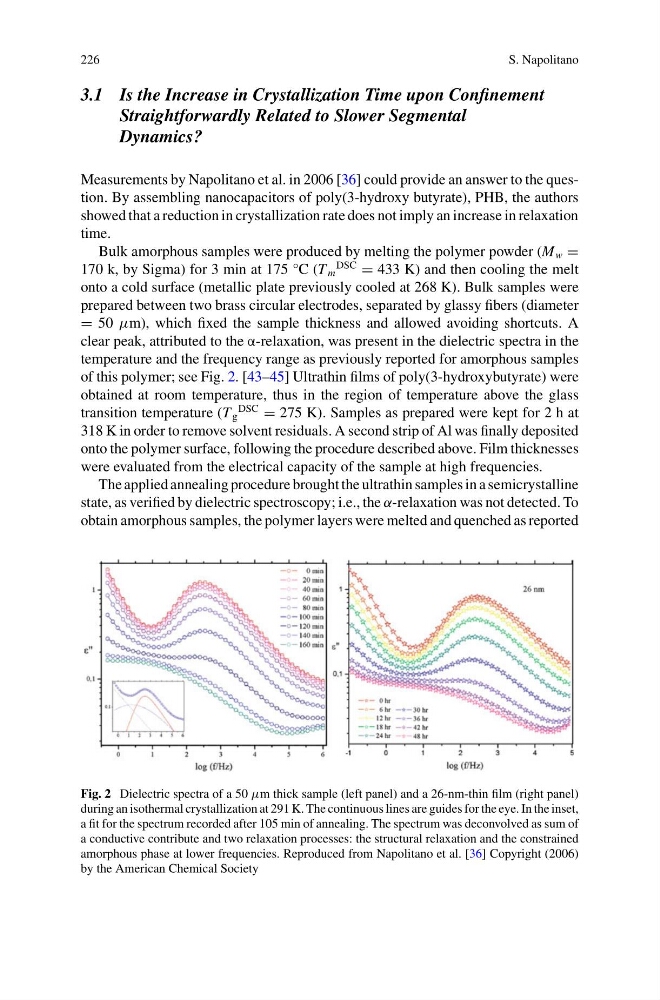
clear peak, attributed to the α-relaxation, was present in the dielectric spectra in the
temperature and the frequency range as previously reported for amorphous samples
of this polymer; see Fig. 2. [43–45] Ultrathin films of poly(3-hydroxybutyrate) were
obtained at room temperature, thus in the region of temperature above the glass
transition temperature (T g
DSC
= 275 K). Samples as prepared were kept for 2 h at
318 K in order to remove solvent residuals. A second strip of Al was finally deposited
onto the polymer surface, following the procedure described above. Film thicknesses
were evaluated from the electrical capacity of the sample at high frequencies.
The applied annealing procedure brought the ultrathin samples in a semicrystalline
state, as verified by dielectric spectroscopy; i.e., the α-relaxation was not detected. To
obtain amorphous samples, the polymer layers were melted and quenched as reported
Fig. 2 Dielectric spectra of a 50 μm thick sample (left panel) and a 26-nm-thin film (right panel)
during an isothermal crystallization at 291 K. The continuous lines are guides for the eye. In the inset,
a fit for the spectrum recorded after 105 min of annealing. The spectrum was deconvolved as sum of
a conductive contribute and two relaxation processes: the structural relaxation and the constrained
amorphous phase at lower frequencies. Reproduced from Napolitano et al. [36] Copyright (2006)
by the American Chemical Society
S. Napolitano
3.1 Is the Increase in Crystallization Time upon Confinement
Straightforwardly Related to Slower Segmental
Dynamics?
Measurements by Napolitano et al. in 2006 [36] could provide an answer to the question. By assembling nanocapacitors of poly(3-hydroxy butyrate), PHB, the authors
showed that a reduction in crystallization rate does not imply an increase in relaxation
time.
Bulk amorphous samples were produced by melting the polymer powder (M w =
170 k, by Sigma) for 3 min at 175 °C (T m
DSC
= 433 K) and then cooling the melt
onto a cold surface (metallic plate previously cooled at 268 K). Bulk samples were
prepared between two brass circular electrodes, separated by glassy fibers (diameter
= 50 μm), which fixed the sample thickness and allowed avoiding shortcuts. A
clear peak, attributed to the α-relaxation, was present in the dielectric spectra in the
temperature and the frequency range as previously reported for amorphous samples
of this polymer; see Fig. 2. [43–45] Ultrathin films of poly(3-hydroxybutyrate) were
obtained at room temperature, thus in the region of temperature above the glass
transition temperature (T g
DSC
= 275 K). Samples as prepared were kept for 2 h at
318 K in order to remove solvent residuals. A second strip of Al was finally deposited
onto the polymer surface, following the procedure described above. Film thicknesses
were evaluated from the electrical capacity of the sample at high frequencies.
The applied annealing procedure brought the ultrathin samples in a semicrystalline
state, as verified by dielectric spectroscopy; i.e., the α-relaxation was not detected. To
obtain amorphous samples, the polymer layers were melted and quenched as reported
Fig. 2 Dielectric spectra of a 50 μm thick sample (left panel) and a 26-nm-thin film (right panel)
during an isothermal crystallization at 291 K. The continuous lines are guides for the eye. In the inset,
a fit for the spectrum recorded after 105 min of annealing. The spectrum was deconvolved as sum of
a conductive contribute and two relaxation processes: the structural relaxation and the constrained
amorphous phase at lower frequencies. Reproduced from Napolitano et al. [36] Copyright (2006)
by the American Chemical Society