

Order and Dielectric Relaxation During Polymer Crystallization
207
range. This fact can enable a characterization during the crystallization of the structure development and of the segmental dynamics evolution by using the β-relaxation
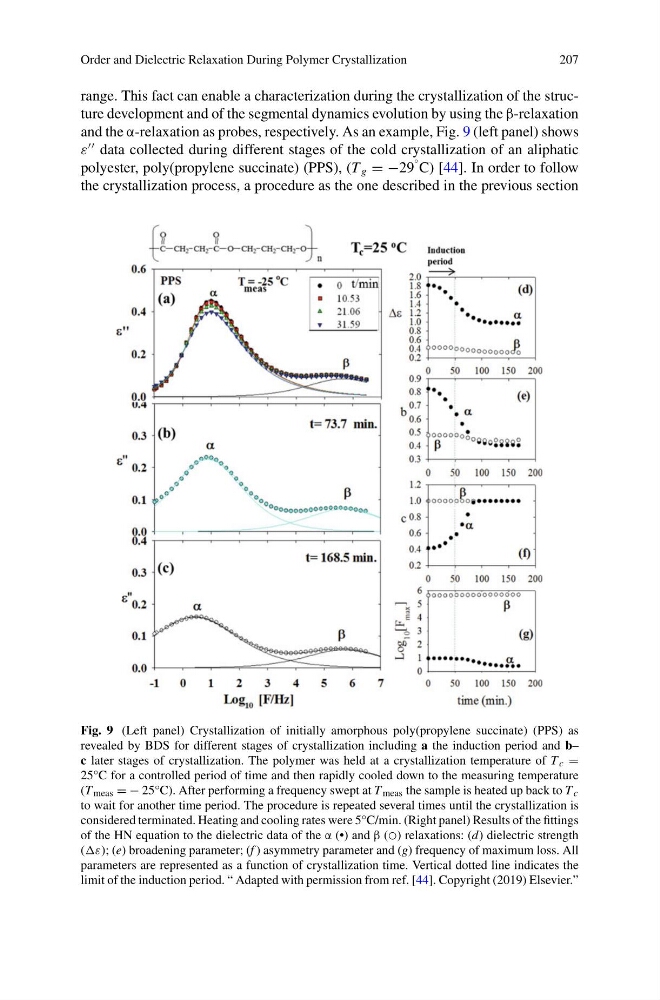
and the α-relaxation as probes, respectively. As an example, Fig. 9 (left panel) shows
ε
data collected during different stages of the cold crystallization of an aliphatic
polyester, poly(propylene succinate) (PPS), (T g = −29
° C) [44]. In order to follow
the crystallization process, a procedure as the one described in the previous section
Fig. 9 (Left panel) Crystallization of initially amorphous poly(propylene succinate) (PPS) as
revealed by BDS for different stages of crystallization including a the induction period and b–
c later stages of crystallization. The polymer was held at a crystallization temperature of T c =
25°C for a controlled period of time and then rapidly cooled down to the measuring temperature
(T meas = − 25°C). After performing a frequency swept at T meas the sample is heated up back to T c
to wait for another time period. The procedure is repeated several times until the crystallization is
considered terminated. Heating and cooling rates were 5°C/min. (Right panel) Results of the fittings
of the HN equation to the dielectric data of the α (•) and β (◯) relaxations: (d) dielectric strength
(ε); (e) broadening parameter; (f ) asymmetry parameter and (g) frequency of maximum loss. All
parameters are represented as a function of crystallization time. Vertical dotted line indicates the
limit of the induction period. “ Adapted with permission from ref. [44]. Copyright (2019) Elsevier.”
207
range. This fact can enable a characterization during the crystallization of the structure development and of the segmental dynamics evolution by using the β-relaxation
and the α-relaxation as probes, respectively. As an example, Fig. 9 (left panel) shows
ε
data collected during different stages of the cold crystallization of an aliphatic
polyester, poly(propylene succinate) (PPS), (T g = −29
° C) [44]. In order to follow
the crystallization process, a procedure as the one described in the previous section
Fig. 9 (Left panel) Crystallization of initially amorphous poly(propylene succinate) (PPS) as
revealed by BDS for different stages of crystallization including a the induction period and b–
c later stages of crystallization. The polymer was held at a crystallization temperature of T c =
25°C for a controlled period of time and then rapidly cooled down to the measuring temperature
(T meas = − 25°C). After performing a frequency swept at T meas the sample is heated up back to T c
to wait for another time period. The procedure is repeated several times until the crystallization is
considered terminated. Heating and cooling rates were 5°C/min. (Right panel) Results of the fittings
of the HN equation to the dielectric data of the α (•) and β (◯) relaxations: (d) dielectric strength
(ε); (e) broadening parameter; (f ) asymmetry parameter and (g) frequency of maximum loss. All
parameters are represented as a function of crystallization time. Vertical dotted line indicates the
limit of the induction period. “ Adapted with permission from ref. [44]. Copyright (2019) Elsevier.”