

Order and Dielectric Relaxation During Polymer Crystallization
201
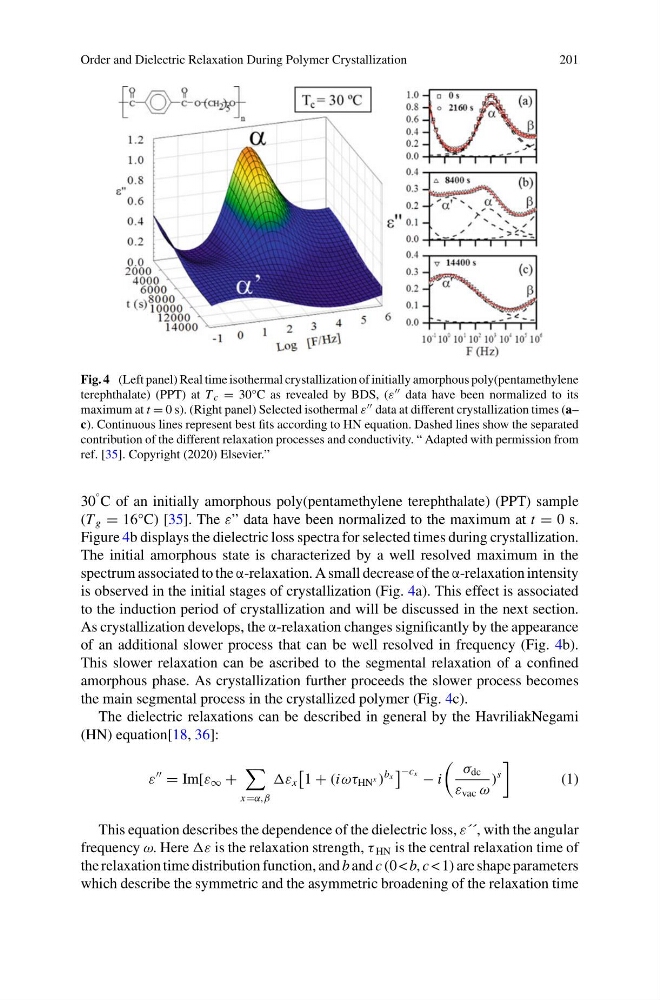
Fig. 4 (Left panel) Real time isothermal crystallization of initially amorphous poly(pentamethylene
terephthalate) (PPT) at T c = 30°C as revealed by BDS, (ε data have been normalized to its
maximum at t = 0 s). (Right panel) Selected isothermal ε data at different crystallization times (a–
c). Continuous lines represent best fits according to HN equation. Dashed lines show the separated
contribution of the different relaxation processes and conductivity. “ Adapted with permission from
ref. [35]. Copyright (2020) Elsevier.”
30
° C of an initially amorphous poly(pentamethylene terephthalate) (PPT) sample
(T g = 16°C) [35]. The ε” data have been normalized to the maximum at t = 0 s.
Figure 4b displays the dielectric loss spectra for selected times during crystallization.
The initial amorphous state is characterized by a well resolved maximum in the
spectrum associated to the α-relaxation. A small decrease of the α-relaxation intensity
is observed in the initial stages of crystallization (Fig. 4a). This effect is associated
to the induction period of crystallization and will be discussed in the next section.
As crystallization develops, the α-relaxation changes significantly by the appearance
of an additional slower process that can be well resolved in frequency (Fig. 4b).
This slower relaxation can be ascribed to the segmental relaxation of a confined
amorphous phase. As crystallization further proceeds the slower process becomes
the main segmental process in the crystallized polymer (Fig. 4c).
The dielectric relaxations can be described in general by the HavriliakNegami
(HN) equation[18, 36]:
ε
= Im[ε ∞ +
x=α,β
ε x
1 + (iωτ HN
x )
b x
−c x − i
σ dc
ε vac ω
)
s
(1)
This equation describes the dependence of the dielectric loss, ε´´, with the angular
frequency ω. Here ε is the relaxation strength, τ HN is the central relaxation time of
the relaxation time distribution function, and b and c (0 < b, c < 1) are shape parameters
which describe the symmetric and the asymmetric broadening of the relaxation time
201
Fig. 4 (Left panel) Real time isothermal crystallization of initially amorphous poly(pentamethylene
terephthalate) (PPT) at T c = 30°C as revealed by BDS, (ε data have been normalized to its
maximum at t = 0 s). (Right panel) Selected isothermal ε data at different crystallization times (a–
c). Continuous lines represent best fits according to HN equation. Dashed lines show the separated
contribution of the different relaxation processes and conductivity. “ Adapted with permission from
ref. [35]. Copyright (2020) Elsevier.”
30
° C of an initially amorphous poly(pentamethylene terephthalate) (PPT) sample
(T g = 16°C) [35]. The ε” data have been normalized to the maximum at t = 0 s.
Figure 4b displays the dielectric loss spectra for selected times during crystallization.
The initial amorphous state is characterized by a well resolved maximum in the
spectrum associated to the α-relaxation. A small decrease of the α-relaxation intensity
is observed in the initial stages of crystallization (Fig. 4a). This effect is associated
to the induction period of crystallization and will be discussed in the next section.
As crystallization develops, the α-relaxation changes significantly by the appearance
of an additional slower process that can be well resolved in frequency (Fig. 4b).
This slower relaxation can be ascribed to the segmental relaxation of a confined
amorphous phase. As crystallization further proceeds the slower process becomes
the main segmental process in the crystallized polymer (Fig. 4c).
The dielectric relaxations can be described in general by the HavriliakNegami
(HN) equation[18, 36]:
ε
= Im[ε ∞ +
x=α,β
ε x
1 + (iωτ HN
x )
b x
−c x − i
σ dc
ε vac ω
)
s
(1)
This equation describes the dependence of the dielectric loss, ε´´, with the angular
frequency ω. Here ε is the relaxation strength, τ HN is the central relaxation time of
the relaxation time distribution function, and b and c (0 < b, c < 1) are shape parameters
which describe the symmetric and the asymmetric broadening of the relaxation time