

Dynamics of Water in Partially Crystallized Solutions of Glass …
179
4.0 4.5 5.0 5.5 6.0 6.5 7.0 7.5
- 6
- 4
- 2
0
4.0
4.5
5.0
5.5
- 8
- 6
- 4
- 2
0
2
(b)
log (τ [s])
1000/T [K
- 1 ]
50%
40%
30%
20%
10%
0% - pure 3PG
α- relaxation
4.0 4.5 5.0 5.5 6.0 6.5 7.0 7.5
- 8
- 6
- 4
- 2
0
2
(c)
(a)
50%
40%
30%
20%
log (τ [s])
1000/T [K
- 1 ]
Water relaxation
1000/T [K
- 1 ]
log (τ)
3PG
c w = 50 wt%
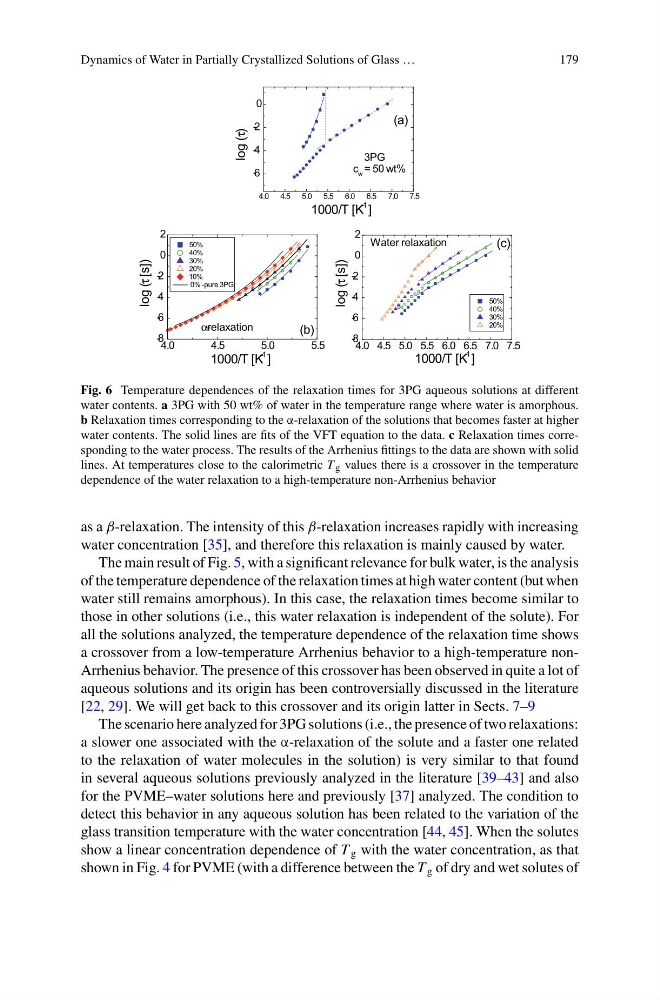
Fig. 6 Temperature dependences of the relaxation times for 3PG aqueous solutions at different
water contents. a 3PG with 50 wt% of water in the temperature range where water is amorphous.
b Relaxation times corresponding to the α-relaxation of the solutions that becomes faster at higher
water contents. The solid lines are fits of the VFT equation to the data. c Relaxation times corresponding to the water process. The results of the Arrhenius fittings to the data are shown with solid
lines. At temperatures close to the calorimetric T g values there is a crossover in the temperature
dependence of the water relaxation to a high-temperature non-Arrhenius behavior
as a β-relaxation. The intensity of this β-relaxation increases rapidly with increasing
water concentration [35], and therefore this relaxation is mainly caused by water.
The main result of Fig. 5, with a significant relevance for bulk water, is the analysis
of the temperature dependence of the relaxation times at high water content (but when
water still remains amorphous). In this case, the relaxation times become similar to
those in other solutions (i.e., this water relaxation is independent of the solute). For
all the solutions analyzed, the temperature dependence of the relaxation time shows
a crossover from a low-temperature Arrhenius behavior to a high-temperature nonArrhenius behavior. The presence of this crossover has been observed in quite a lot of
aqueous solutions and its origin has been controversially discussed in the literature
[22, 29]. We will get back to this crossover and its origin latter in Sects. 7–9
The scenario here analyzed for 3PG solutions (i.e., the presence of two relaxations:
a slower one associated with the α-relaxation of the solute and a faster one related
to the relaxation of water molecules in the solution) is very similar to that found
in several aqueous solutions previously analyzed in the literature [39–43] and also
for the PVME–water solutions here and previously [37] analyzed. The condition to
detect this behavior in any aqueous solution has been related to the variation of the
glass transition temperature with the water concentration [44, 45]. When the solutes
show a linear concentration dependence of T g with the water concentration, as that
shown in Fig. 4 for PVME (with a difference between the T g of dry and wet solutes of
179
4.0 4.5 5.0 5.5 6.0 6.5 7.0 7.5
- 6
- 4
- 2
0
4.0
4.5
5.0
5.5
- 8
- 6
- 4
- 2
0
2
(b)
log (τ [s])
1000/T [K
- 1 ]
50%
40%
30%
20%
10%
0% - pure 3PG
α- relaxation
4.0 4.5 5.0 5.5 6.0 6.5 7.0 7.5
- 8
- 6
- 4
- 2
0
2
(c)
(a)
50%
40%
30%
20%
log (τ [s])
1000/T [K
- 1 ]
Water relaxation
1000/T [K
- 1 ]
log (τ)
3PG
c w = 50 wt%
Fig. 6 Temperature dependences of the relaxation times for 3PG aqueous solutions at different
water contents. a 3PG with 50 wt% of water in the temperature range where water is amorphous.
b Relaxation times corresponding to the α-relaxation of the solutions that becomes faster at higher
water contents. The solid lines are fits of the VFT equation to the data. c Relaxation times corresponding to the water process. The results of the Arrhenius fittings to the data are shown with solid
lines. At temperatures close to the calorimetric T g values there is a crossover in the temperature
dependence of the water relaxation to a high-temperature non-Arrhenius behavior
as a β-relaxation. The intensity of this β-relaxation increases rapidly with increasing
water concentration [35], and therefore this relaxation is mainly caused by water.
The main result of Fig. 5, with a significant relevance for bulk water, is the analysis
of the temperature dependence of the relaxation times at high water content (but when
water still remains amorphous). In this case, the relaxation times become similar to
those in other solutions (i.e., this water relaxation is independent of the solute). For
all the solutions analyzed, the temperature dependence of the relaxation time shows
a crossover from a low-temperature Arrhenius behavior to a high-temperature nonArrhenius behavior. The presence of this crossover has been observed in quite a lot of
aqueous solutions and its origin has been controversially discussed in the literature
[22, 29]. We will get back to this crossover and its origin latter in Sects. 7–9
The scenario here analyzed for 3PG solutions (i.e., the presence of two relaxations:
a slower one associated with the α-relaxation of the solute and a faster one related
to the relaxation of water molecules in the solution) is very similar to that found
in several aqueous solutions previously analyzed in the literature [39–43] and also
for the PVME–water solutions here and previously [37] analyzed. The condition to
detect this behavior in any aqueous solution has been related to the variation of the
glass transition temperature with the water concentration [44, 45]. When the solutes
show a linear concentration dependence of T g with the water concentration, as that
shown in Fig. 4 for PVME (with a difference between the T g of dry and wet solutes of