

Dynamics of Water in Partially Crystallized Solutions of Glass …
177
160 180 200 220 240 260 280
-0.6
-0.4
-0.2
0.0
160 180 200 220 240 260 280
-0.6
-0.4
-0.2
0.0
160 180 200 220 240 260 280
-0.6
-0.4
-0.2
0.0
(a)
T c = 200 K
t c = 8 hours
3PG (c w = 50 wt%)
Rev. HF [a.u.]
T [K]
Before crystallization
After crystallization
Melting
(b)
T c = 204 K
t c = 4 hours
3PG (c w = 50 wt%)
Rev. HF [a.u.]
T [K]
Before crystallization
After crystallization
Melting
3PG (c w = 50 wt%)
(c)
T c = 228 K
t c = 2 hours
Rev. HF [a.u.]
T [K]
Before crystallization
After crystallization
Melting
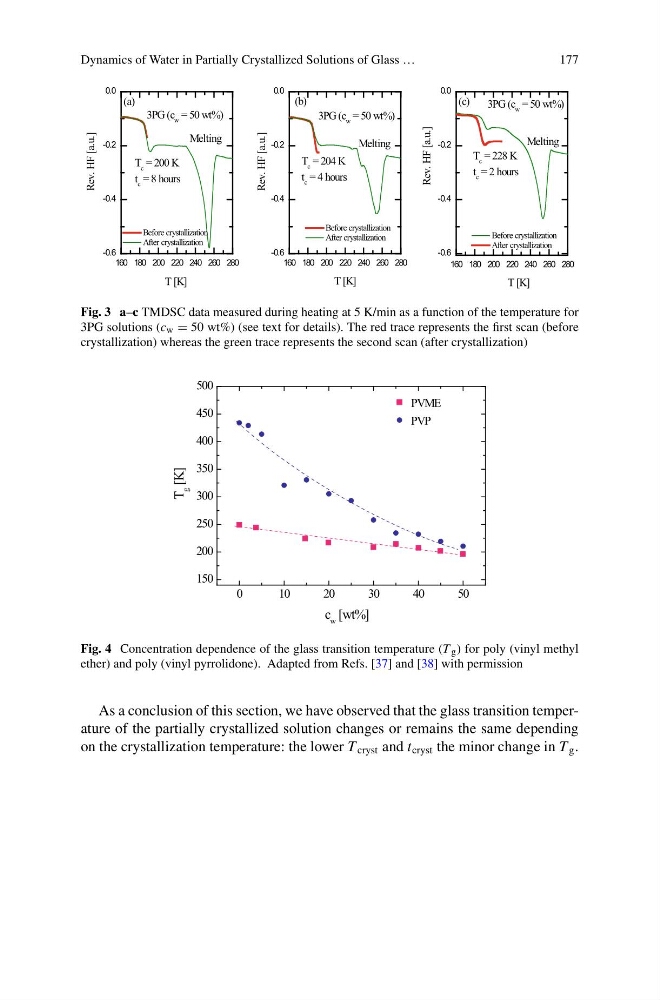
Fig. 3 a–c TMDSC data measured during heating at 5 K/min as a function of the temperature for
3PG solutions (c w = 50 wt%) (see text for details). The red trace represents the first scan (before
crystallization) whereas the green trace represents the second scan (after crystallization)
0
1 0
2 0
3 0
4 0
5 0
150
200
250
300
350
400
450
500
T
g
[K]
c w [wt%]
PVME
PVP
Fig. 4 Concentration dependence of the glass transition temperature (T g ) for poly (vinyl methyl
ether) and poly (vinyl pyrrolidone). Adapted from Refs. [37] and [38] with permission
As a conclusion of this section, we have observed that the glass transition temperature of the partially crystallized solution changes or remains the same depending
on the crystallization temperature: the lower T cryst and t cryst the minor change in T g .
177
160 180 200 220 240 260 280
-0.6
-0.4
-0.2
0.0
160 180 200 220 240 260 280
-0.6
-0.4
-0.2
0.0
160 180 200 220 240 260 280
-0.6
-0.4
-0.2
0.0
(a)
T c = 200 K
t c = 8 hours
3PG (c w = 50 wt%)
Rev. HF [a.u.]
T [K]
Before crystallization
After crystallization
Melting
(b)
T c = 204 K
t c = 4 hours
3PG (c w = 50 wt%)
Rev. HF [a.u.]
T [K]
Before crystallization
After crystallization
Melting
3PG (c w = 50 wt%)
(c)
T c = 228 K
t c = 2 hours
Rev. HF [a.u.]
T [K]
Before crystallization
After crystallization
Melting
Fig. 3 a–c TMDSC data measured during heating at 5 K/min as a function of the temperature for
3PG solutions (c w = 50 wt%) (see text for details). The red trace represents the first scan (before
crystallization) whereas the green trace represents the second scan (after crystallization)
0
1 0
2 0
3 0
4 0
5 0
150
200
250
300
350
400
450
500
T
g
[K]
c w [wt%]
PVME
PVP
Fig. 4 Concentration dependence of the glass transition temperature (T g ) for poly (vinyl methyl
ether) and poly (vinyl pyrrolidone). Adapted from Refs. [37] and [38] with permission
As a conclusion of this section, we have observed that the glass transition temperature of the partially crystallized solution changes or remains the same depending
on the crystallization temperature: the lower T cryst and t cryst the minor change in T g .