

174
S. Cerveny and J. Swenson
transition temperature (T g ) can be determined, and on the other side, crystallization of
water at sub-zero temperatures can be detected. At a given cooling rate and depending
on water content, crystallization of water can be suppressed for all temperatures. This
is the case for solutions with water content lower than 25 wt% where crystallization
of water is inhibited on both cooling and heating cycles. However, at higher water
content, crystallization on cooling or on heating (the so-called cold crystallization)
can be detected. In general, cold crystallization occurs in solutions when the water
content remains above 25 wt%.
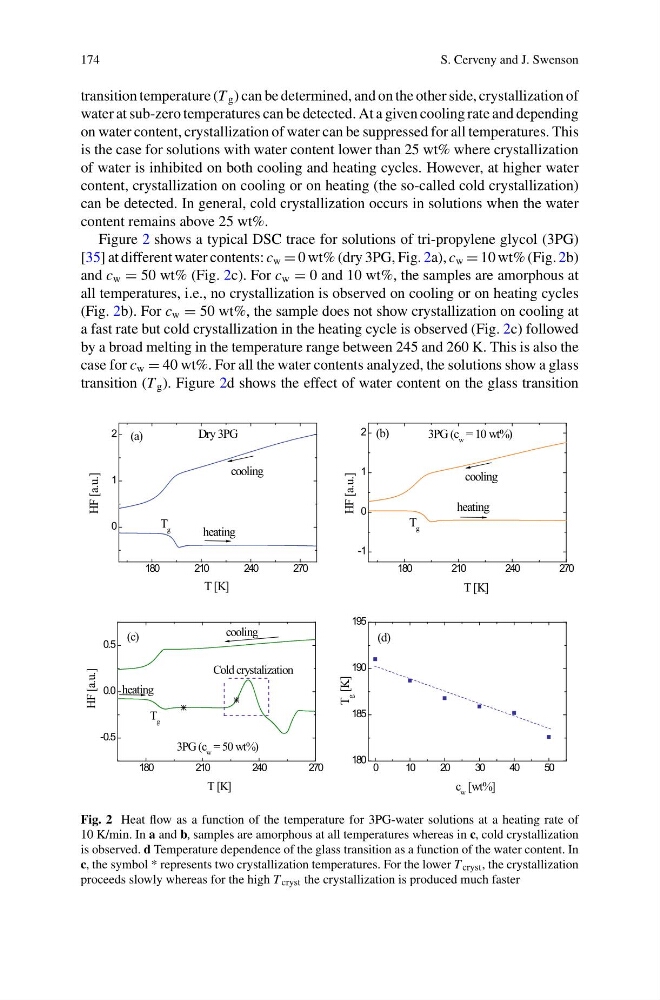
Figure 2 shows a typical DSC trace for solutions of tri-propylene glycol (3PG)
[35] at different water contents: c w = 0 wt% (dry 3PG, Fig. 2a), c w = 10 wt% (Fig. 2b)
and c w = 50 wt% (Fig. 2c). For c w = 0 and 10 wt%, the samples are amorphous at
all temperatures, i.e., no crystallization is observed on cooling or on heating cycles
(Fig. 2b). For c w = 50 wt%, the sample does not show crystallization on cooling at
a fast rate but cold crystallization in the heating cycle is observed (Fig. 2c) followed
by a broad melting in the temperature range between 245 and 260 K. This is also the
case for c w = 40 wt%. For all the water contents analyzed, the solutions show a glass
transition (T g ). Figure 2d shows the effect of water content on the glass transition
180
210
240
270
0
1
2
180
210
240
270
-1
0
1
2
180
210
240
270
-0.5
0.0
0.5
0
1 0
2 0
3 0
4 0
5 0
180
185
190
195
cooling
heating
T g
HF [a.u.]
T [K]
Dry 3PG
(a)
cooling
heating
T g
HF [a.u.]
T [K]
3PG (c w = 10 wt%)
(b)
cooling
heating
T g
HF [a.u.]
T [K]
Cold crystalization
3PG (c w = 50 wt%)
(c)
(d)
T
g
[K]
c w [wt%]
Fig. 2 Heat flow as a function of the temperature for 3PG-water solutions at a heating rate of
10 K/min. In a and b, samples are amorphous at all temperatures whereas in c, cold crystallization
is observed. d Temperature dependence of the glass transition as a function of the water content. In
c, the symbol * represents two crystallization temperatures. For the lower T cryst , the crystallization
proceeds slowly whereas for the high T cryst the crystallization is produced much faster
S. Cerveny and J. Swenson
transition temperature (T g ) can be determined, and on the other side, crystallization of
water at sub-zero temperatures can be detected. At a given cooling rate and depending
on water content, crystallization of water can be suppressed for all temperatures. This
is the case for solutions with water content lower than 25 wt% where crystallization
of water is inhibited on both cooling and heating cycles. However, at higher water
content, crystallization on cooling or on heating (the so-called cold crystallization)
can be detected. In general, cold crystallization occurs in solutions when the water
content remains above 25 wt%.
Figure 2 shows a typical DSC trace for solutions of tri-propylene glycol (3PG)
[35] at different water contents: c w = 0 wt% (dry 3PG, Fig. 2a), c w = 10 wt% (Fig. 2b)
and c w = 50 wt% (Fig. 2c). For c w = 0 and 10 wt%, the samples are amorphous at
all temperatures, i.e., no crystallization is observed on cooling or on heating cycles
(Fig. 2b). For c w = 50 wt%, the sample does not show crystallization on cooling at
a fast rate but cold crystallization in the heating cycle is observed (Fig. 2c) followed
by a broad melting in the temperature range between 245 and 260 K. This is also the
case for c w = 40 wt%. For all the water contents analyzed, the solutions show a glass
transition (T g ). Figure 2d shows the effect of water content on the glass transition
180
210
240
270
0
1
2
180
210
240
270
-1
0
1
2
180
210
240
270
-0.5
0.0
0.5
0
1 0
2 0
3 0
4 0
5 0
180
185
190
195
cooling
heating
T g
HF [a.u.]
T [K]
Dry 3PG
(a)
cooling
heating
T g
HF [a.u.]
T [K]
3PG (c w = 10 wt%)
(b)
cooling
heating
T g
HF [a.u.]
T [K]
Cold crystalization
3PG (c w = 50 wt%)
(c)
(d)
T
g
[K]
c w [wt%]
Fig. 2 Heat flow as a function of the temperature for 3PG-water solutions at a heating rate of
10 K/min. In a and b, samples are amorphous at all temperatures whereas in c, cold crystallization
is observed. d Temperature dependence of the glass transition as a function of the water content. In
c, the symbol * represents two crystallization temperatures. For the lower T cryst , the crystallization
proceeds slowly whereas for the high T cryst the crystallization is produced much faster