

Control of Crystallization Pathways by Electric Fields
161
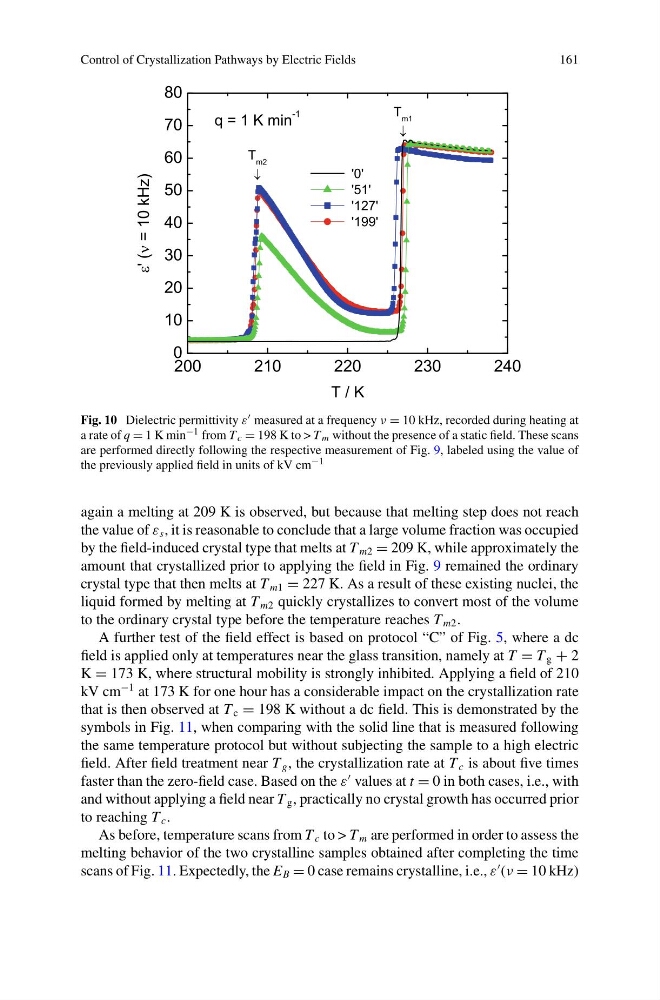
Fig. 10 Dielectric permittivity ε measured at a frequency ν = 10 kHz, recorded during heating at
a rate of q = 1 K min −1 from T c = 198 K to > T m without the presence of a static field. These scans
are performed directly following the respective measurement of Fig. 9, labeled using the value of
the previously applied field in units of kV cm −1
again a melting at 209 K is observed, but because that melting step does not reach
the value of ε s , it is reasonable to conclude that a large volume fraction was occupied
by the field-induced crystal type that melts at T m2 = 209 K, while approximately the
amount that crystallized prior to applying the field in Fig. 9 remained the ordinary
crystal type that then melts at T m1 = 227 K. As a result of these existing nuclei, the
liquid formed by melting at T m2 quickly crystallizes to convert most of the volume
to the ordinary crystal type before the temperature reaches T m2 .
A further test of the field effect is based on protocol “C” of Fig. 5, where a dc
field is applied only at temperatures near the glass transition, namely at T = T g + 2
K = 173 K, where structural mobility is strongly inhibited. Applying a field of 210
kV cm
−1 at 173 K for one hour has a considerable impact on the crystallization rate
that is then observed at T c = 198 K without a dc field. This is demonstrated by the
symbols in Fig. 11, when comparing with the solid line that is measured following
the same temperature protocol but without subjecting the sample to a high electric
field. After field treatment near T g , the crystallization rate at T c is about five times
faster than the zero-field case. Based on the ε
values at t = 0 in both cases, i.e., with
and without applying a field near T g , practically no crystal growth has occurred prior
to reaching T c .
As before, temperature scans from T c to > T m are performed in order to assess the
melting behavior of the two crystalline samples obtained after completing the time
scans of Fig. 11. Expectedly, the E B = 0 case remains crystalline, i.e., ε
(ν = 10 kHz)
161
Fig. 10 Dielectric permittivity ε measured at a frequency ν = 10 kHz, recorded during heating at
a rate of q = 1 K min −1 from T c = 198 K to > T m without the presence of a static field. These scans
are performed directly following the respective measurement of Fig. 9, labeled using the value of
the previously applied field in units of kV cm −1
again a melting at 209 K is observed, but because that melting step does not reach
the value of ε s , it is reasonable to conclude that a large volume fraction was occupied
by the field-induced crystal type that melts at T m2 = 209 K, while approximately the
amount that crystallized prior to applying the field in Fig. 9 remained the ordinary
crystal type that then melts at T m1 = 227 K. As a result of these existing nuclei, the
liquid formed by melting at T m2 quickly crystallizes to convert most of the volume
to the ordinary crystal type before the temperature reaches T m2 .
A further test of the field effect is based on protocol “C” of Fig. 5, where a dc
field is applied only at temperatures near the glass transition, namely at T = T g + 2
K = 173 K, where structural mobility is strongly inhibited. Applying a field of 210
kV cm
−1 at 173 K for one hour has a considerable impact on the crystallization rate
that is then observed at T c = 198 K without a dc field. This is demonstrated by the
symbols in Fig. 11, when comparing with the solid line that is measured following
the same temperature protocol but without subjecting the sample to a high electric
field. After field treatment near T g , the crystallization rate at T c is about five times
faster than the zero-field case. Based on the ε
values at t = 0 in both cases, i.e., with
and without applying a field near T g , practically no crystal growth has occurred prior
to reaching T c .
As before, temperature scans from T c to > T m are performed in order to assess the
melting behavior of the two crystalline samples obtained after completing the time
scans of Fig. 11. Expectedly, the E B = 0 case remains crystalline, i.e., ε
(ν = 10 kHz)